The Time to Double
The speed of markets is often based on the underlying conditions of greed and fear, and we all understand that the more extreme the emotion, the greater the movements of markets. Given the pressure being placed on energy markets due to the conflict in Ukraine, gas in particular is a market we are seeing that is moving very quickly.
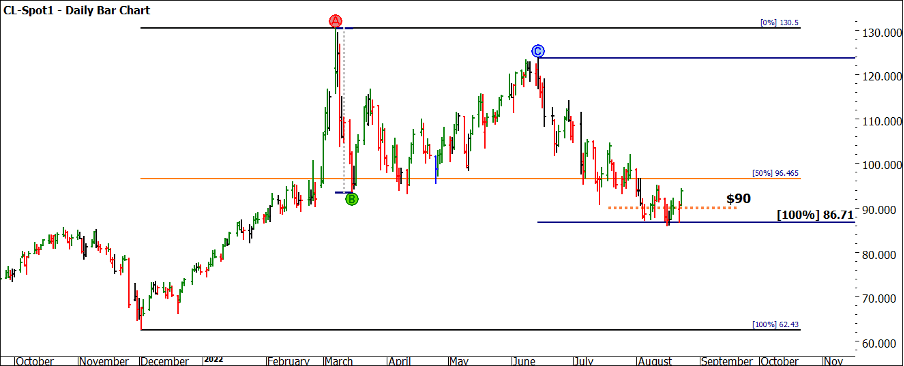
If we examine asset classes, there are not too many that can double in value in a few short weeks, not even Australian real estate prices. The natural gas market is one that has often been in play for me when the oil market misbehaves or heads into a sideways dance. Chart 1 shows the crude oil market, and we can see that prices have eased recently but overall, we are still trading between the December to March range from 2021 to 2022. I do note the repeating range into the current low and how the $90 price is one to watch. Remember we value 90 in terms of a time value but it is also important as a price.
Chart 1 – Daily Bar Chart CL-Spot1
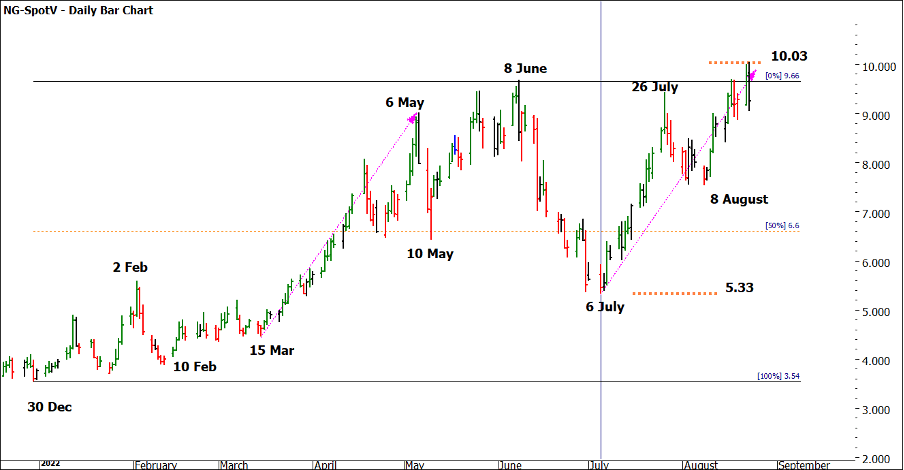
Many speculators are drawn to crypto due to its ability to move quickly, well I contend under the right circumstances that commodity futures can offer the same ride with a high dose of regulation but that’s a discussion for another time. Chart 2 shows natural gas from NYMEX and the moves in 2022 alone.
Chart 2 – Daily Bar Chart NG-Spotv
There is a lot to digest here in the chart so I will highlight the main points.
We have seen prices move from the July low of 5.33 to the current high of 10.03, just short of doubling it’s price in 50 calendar days.
The current move from July is very similar to the March to May run this year as referenced by the speed angle in purple.
The days of the month that reference turns, are suggesting a pattern of which week in the month is offering the most tradeable turns.
For those students who apply Road Maps from previous periods of markets one section I am following closely takes us back 15 years to the 2007 section of the market. This could provide a guide for us to follow closely.
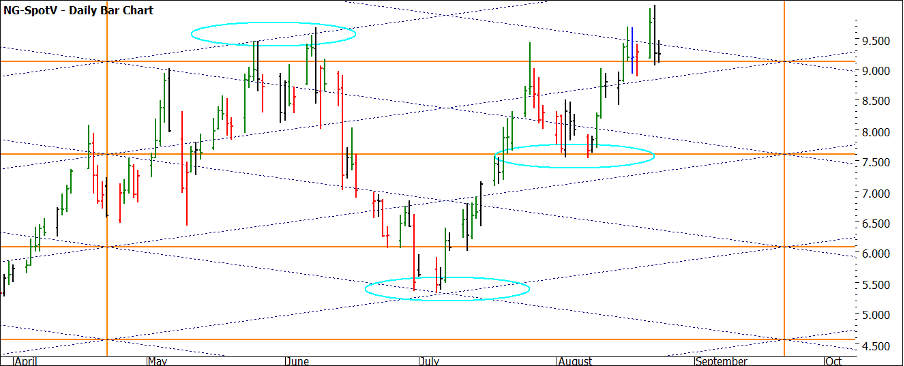
The most recent major low on gas was 1.52 just after the initial COVID panic hit markets in 2020. I have found that this low as a resistance card as well as a square has been advantageous in supporting evidence for turns. You should recreate this square and mark the areas you see as being useful, but I have highlighted 3 more recent areas that have assisted. Full squares and diagonals have been good places to watch for support and resistance.
Chart 3 – Daily Bar Chart NG-Spotv
It’s not surprising that when we overlay these areas, we see our other techniques aligning as well. These three areas are 8 June, 6 July, and 8 August. These are three readily available places for you to back test how you might have set them up and applied your trading plan. Using a straightforward entry and stop management has allowed these three trades to accumulate to just under 20 times risk in terms of reward.
The speed of this market again proves the value of preparation and research prior to the year beginning. For example, Master Time Cycles provided some insights into what we might expect in 2022, for those who can create Road Maps these tools can provide a signal to the type of year one may see. Of course, the next question is what’s next? A continued bull or a retreating bear?
Energy and gas will become more in focus as the northern hemisphere winter kicks in as they are heavily reliant on gas. The Ukraine/Russia conflict means supply from Russia will continue to be used as a weapon in itself. We might assume that the bull will continue to rage.
The current high in terms of repeating ranges and milestones suggests resistance is a factor. You will find some major milestones if you put in the work. I am also looking at the sections of the market and contemplating are we in the third or fourth section? Either way the current top of the 23rd of August will be a good indicator of what is next based on price breaking above or holding below.
Good Trading
Aaron Lynch


