The Value of 50%
This year has brought about a change of emotions as optimism has soured very quickly into pessimism. If we step back and view the psychology globally when COVID first arrived there was genuine fear that was met with a high degree of resilience as the world found a way to overcome this viral menace.
The markets did more than enough to mug the bears as markets initially dived in February / March 2020 followed by a historically significant bull run. Now we have seen the bears are in control and markets are cratering across the board with the previous darling’s “technology” stocks being the hardest hit. So, before we look at the technical side of markets, I’d like to review the foundations of our analysis through the lens of what Gann and David created many decades ago and ask do those beliefs hold true?
Gann’s quote “nor a bunch of bulls or bevy of bears will make a market turn out of season” to me is the essence of cycles and history repeating. In its simplistic form it’s a case of when its time, its time and no amount of agreement or disagreement will change the outcome. This as a concept is a leap of faith especially at the beginning of the journey, however, the longer I am around markets the more comfortable I become with the concept. We just must be better and become better at understanding where the cycles start and finish.
The next point to recognise is what works on the small works on the large. As we are seeing a large move in the dollars/cents or points, and markets are moving, we get headlines that crow how many billions are being lost in the market each day they are down. They don’t say that being short would have allowed us to be part of the profit that movement generated. Our greatest advantage is that we don’t have to be in the market all the time and can trade in more than one direction, ie long and short.
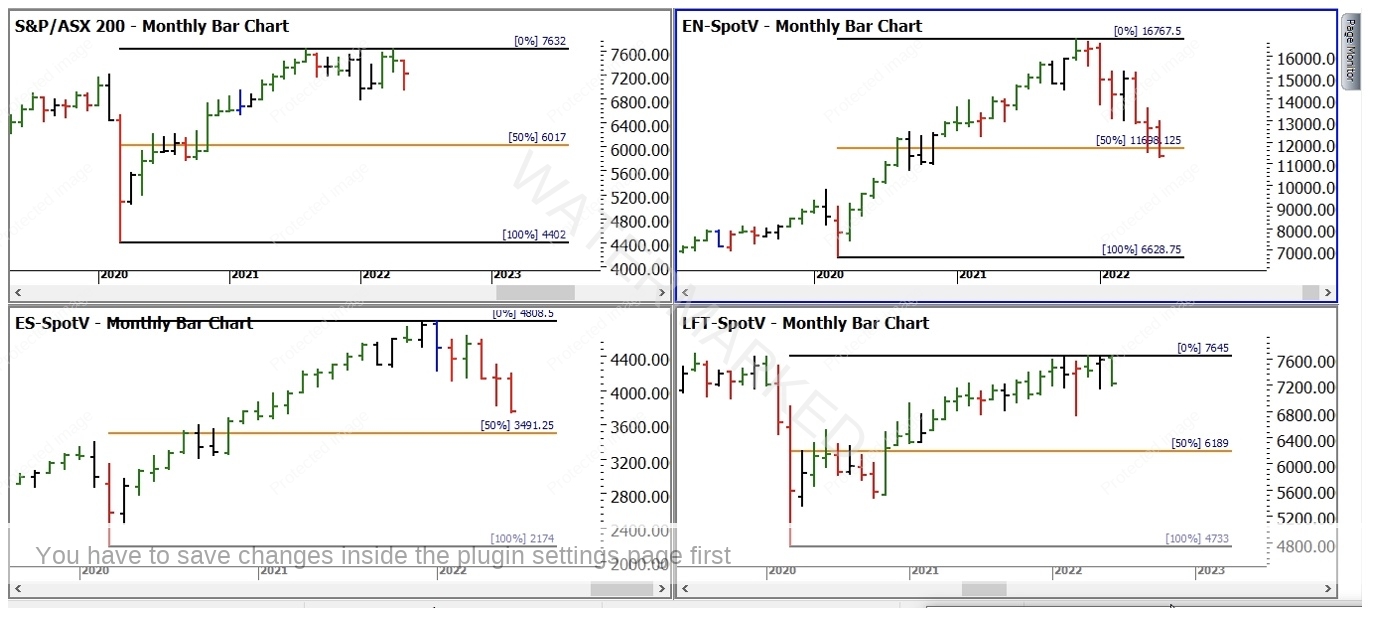
I find the best way to get a sense of movement in a relative sense is to look at percentage retracements or extensions, this is our work on milestones. Gann said that you could make a fortune just by trading the 50% rule alone, and I see these everyday on various markets and time frames. Let’s look at what we can see currently across four major index markets. In Chart 1 below, we have the local ASX 200, the Nasdaq, the S&P 500 and the FTSE100 from the UK. As a percentage retracement of the 2020 to 2022 range we see the only market to have broken the 50% level is the Nasdaq, which has been driven by the serious declines in stocks like Facebook.
Chart 1 – Global Indices
The FTSE 100 is trading near its recent highs and may yet be primed for more downside but in comparison it has hung in quite well compared to the US markets. Again, let’s step back and look at the theory and apply it to the small and large. After a big move we look for a less than 50% retracement to rate the strength of our ABC trade. The 50% level is neither strong or weak but balanced. After the largest movement in stock market history since the 2020 lows, I would think a retracement of 50% or more is warranted.
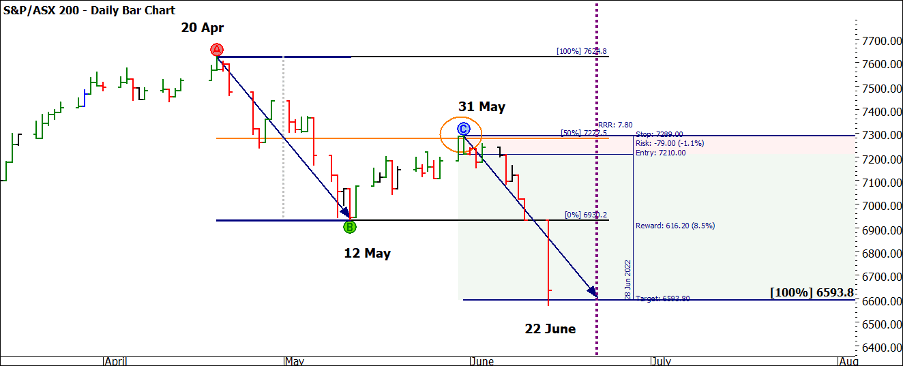
That does mean we stay paralysed to the notion that the market can only go up. We can consider short trades where appropriate and there has been significant opportunity to short the market recently. I just ask you to insulate yourselves from the news and the noise that suggests markets are over. As I type, the Australian markets are down 4.5% and the news is playing this up as the end of civilisation. This can often be where markets reverse. If we look at Chart 2 below, you will see that the trend on the ASX 200 has been down and there was no signal to be long. If we step back and see the larger pattern from April this year, a big picture ABC short has been percolating. I note how well the Point C at the end of May aligned with the 50% rule, this time as a retracement to the upside (we are seeing cycles inside cycles).
Chart 2 – Daily Bar Chart XJO 200
The price action fell into the 100% milestone in the session today generating a 7 to 1 Reward to Risk Ratio. The market is traveling faster to the downside in this run compared to the previous A to B range. If we use time as a guide, then 22 June may have been an area to watch, now we wait and see what sort of reaction we may see. The next few days will tell an interesting story, all markets need their individual heartbeat examined.
Remember the 50% levels on all time frames should be understood as to how they work into the big picture. As traders we seek the sort of volatility we are experiencing. It’s time to embrace it and follow your own roadmap. Turn off the news to ensure you can remain connected to your own analysis.
Good Trading
Aaron Lynch

