The When and Where?
The questions I often receive from new traders relates to the philosophy of how I uncover the two foundational questions, where is a market going and when will it get there? These two questions are often thought as being random or unknown. Believing that history repeats allows me to research the back story to provide a guide for the future.
There are no guarantees as we know, but if we get it right enough of the time and manage the risks associated with any investment, we should be ok. As Gann traders we look to answer both of these questions using price and time. The price part is akin to knowing where to get the bus from i.e. where is the bus stop and the second is when its coming (the timetable).
I have been enjoying my more recent involvement with Boeing, a major US stock and global brand. Continuing from recent articles, the long position was a positive result and now being off the bus so to speak, I am keen to understand where the next bus stop maybe to jump on.
I mentioned the price level of $267 in my last article, and this is purely where some old tops line up. After a reaction of 4 days down (the most since November last year), the price action has again perked up and formed a base and maybe heading higher. The following charts are all Price Forecasting techniques to establish price targets and then attempt to create a cluster at the same levels.
Charts 1- 4 all use a Low Resistance Card to determine multiples of the low. I have noted how many multiples of what low I have used on each chart.
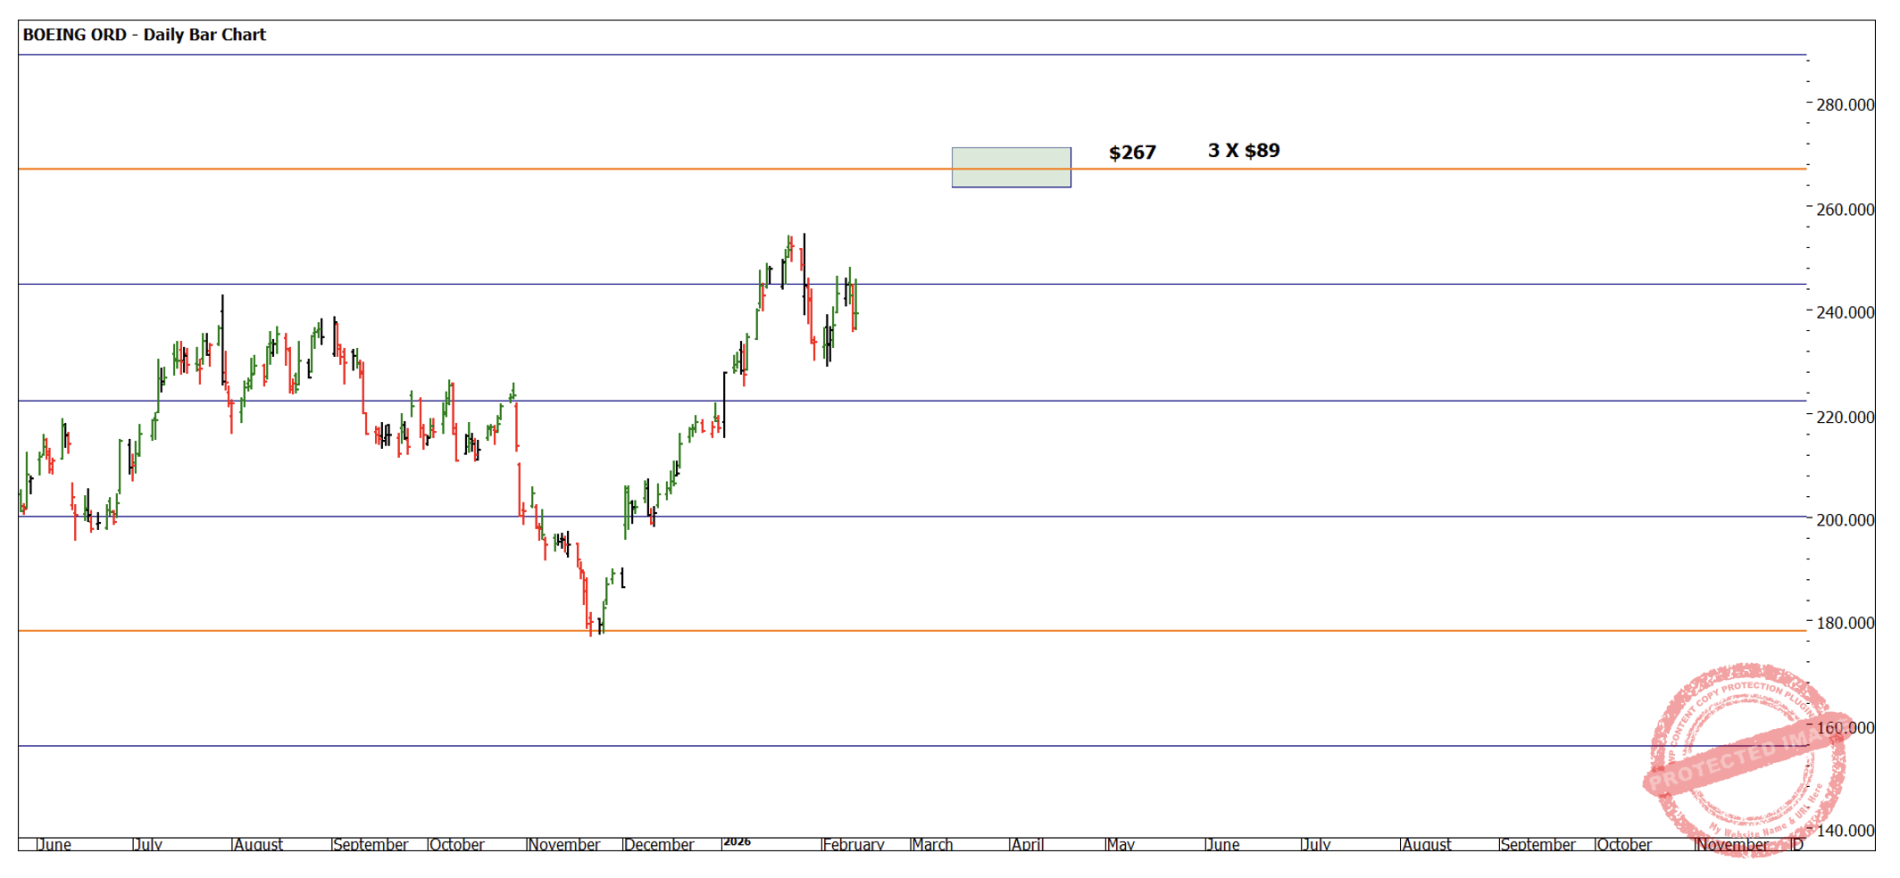
Chart 1 – Daily Bar Chart BA.NYSE
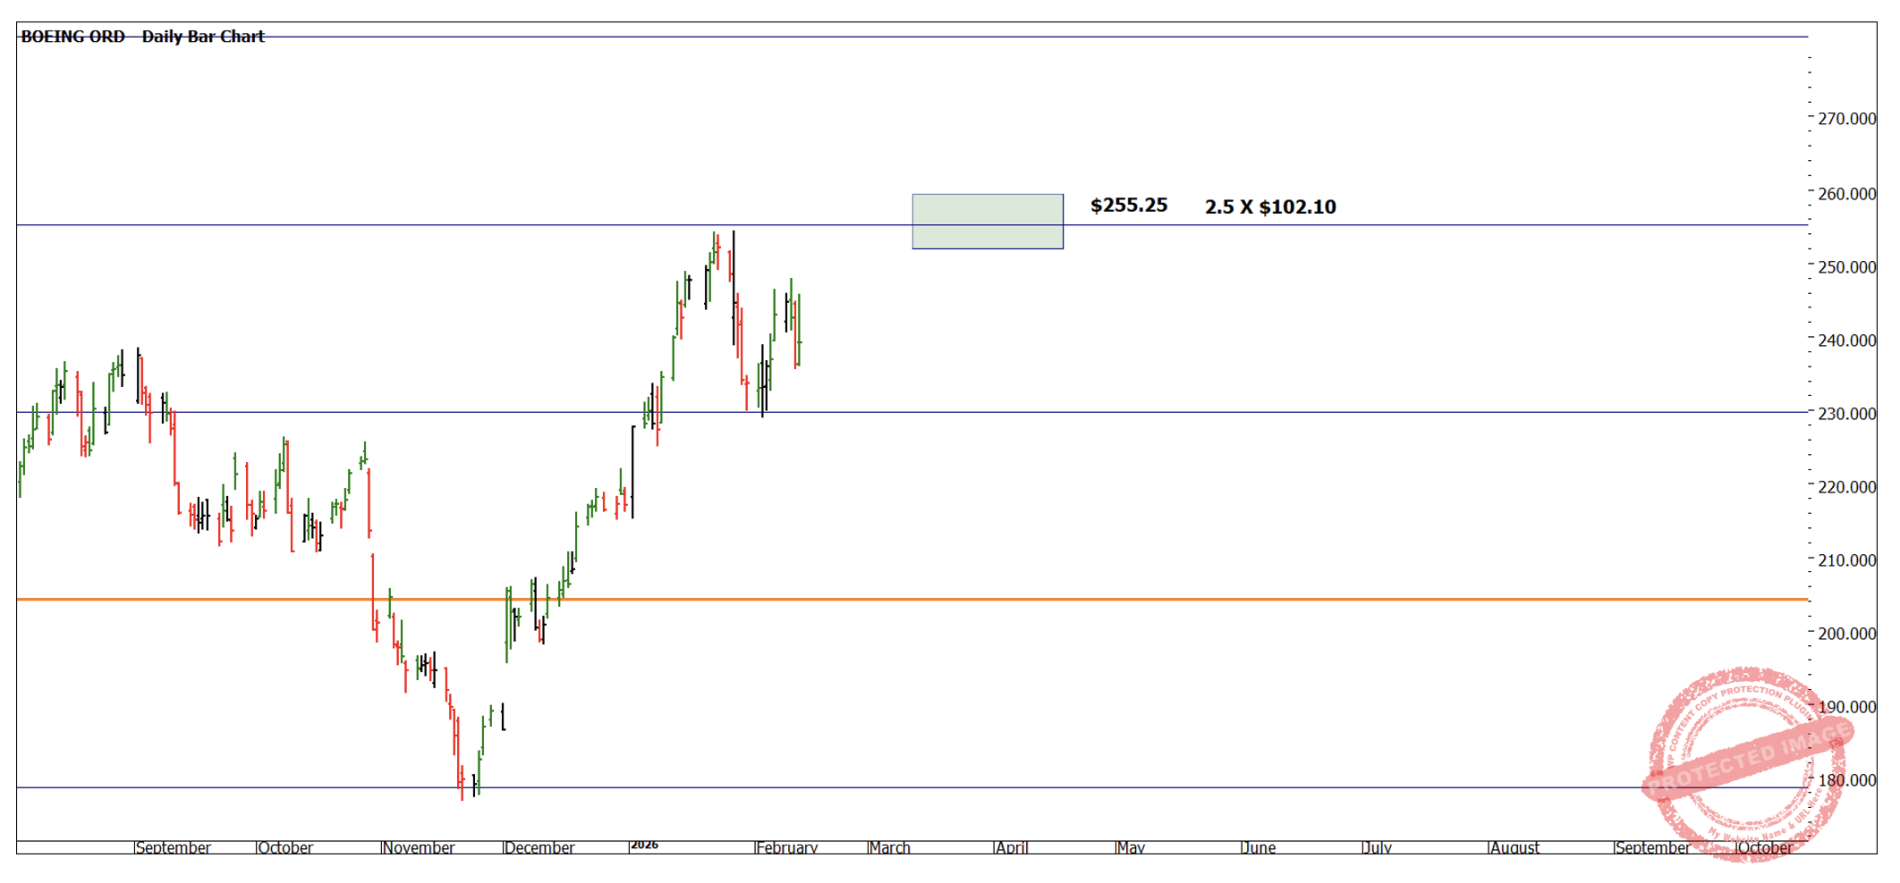
Chart 2 – Daily Bar Chart BA.NYSE
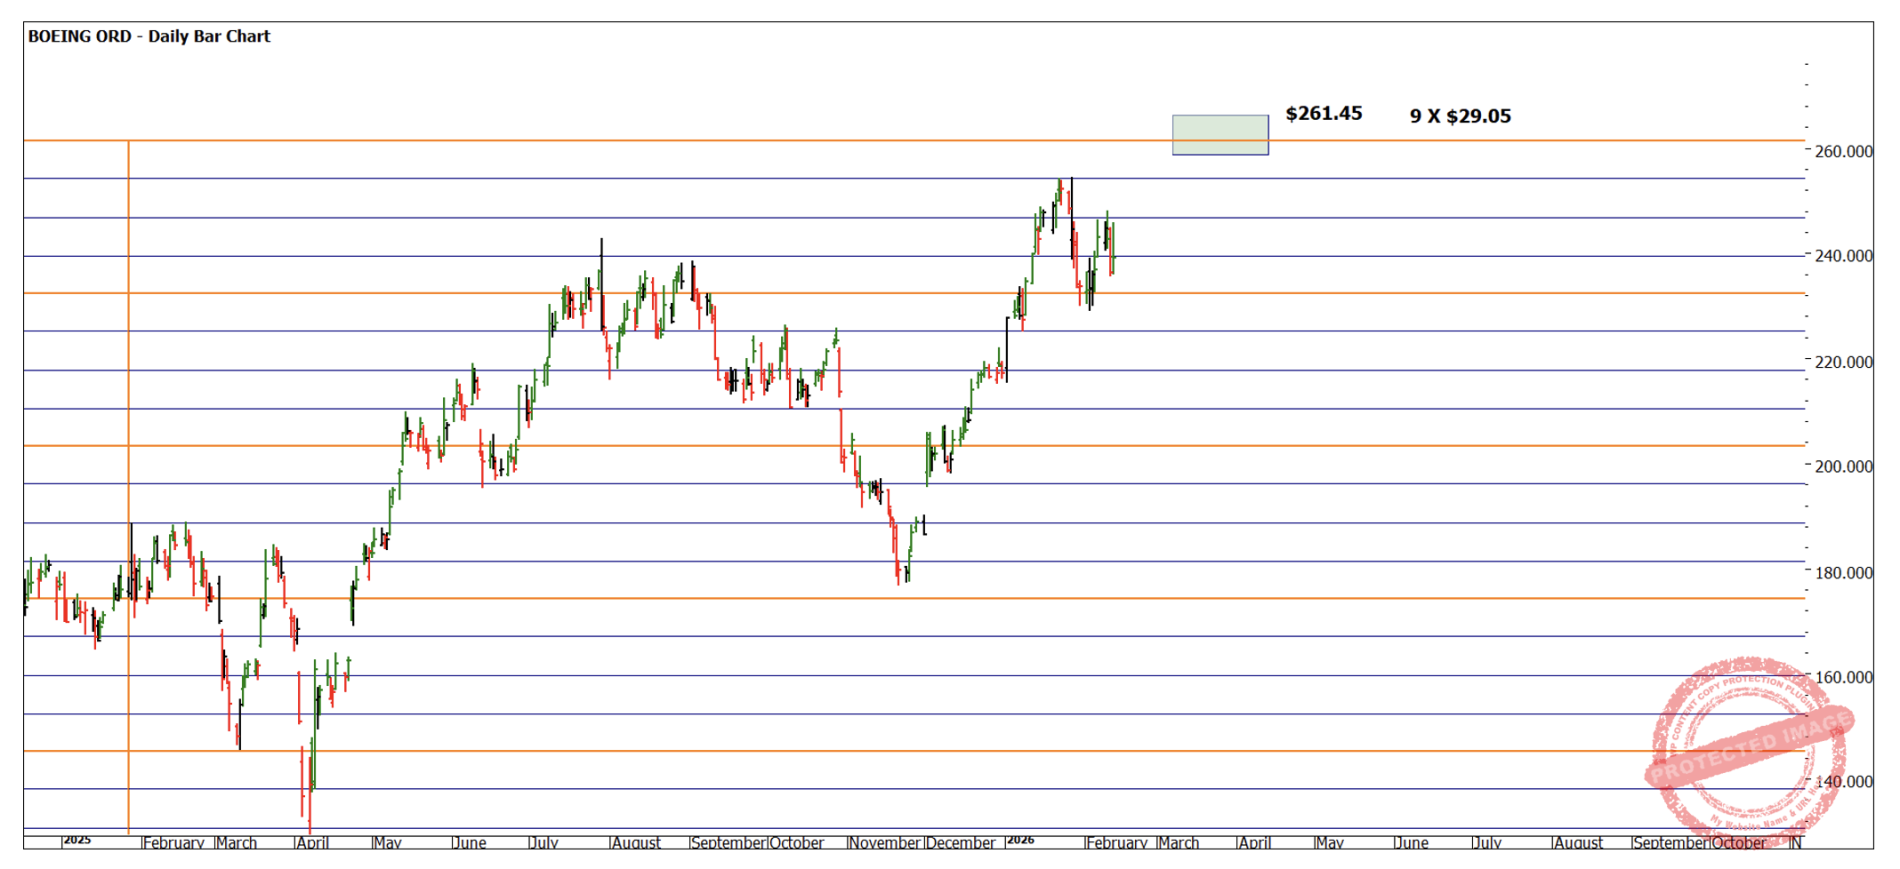
Chart 3 – Daily Bar Chart BA.NYSE
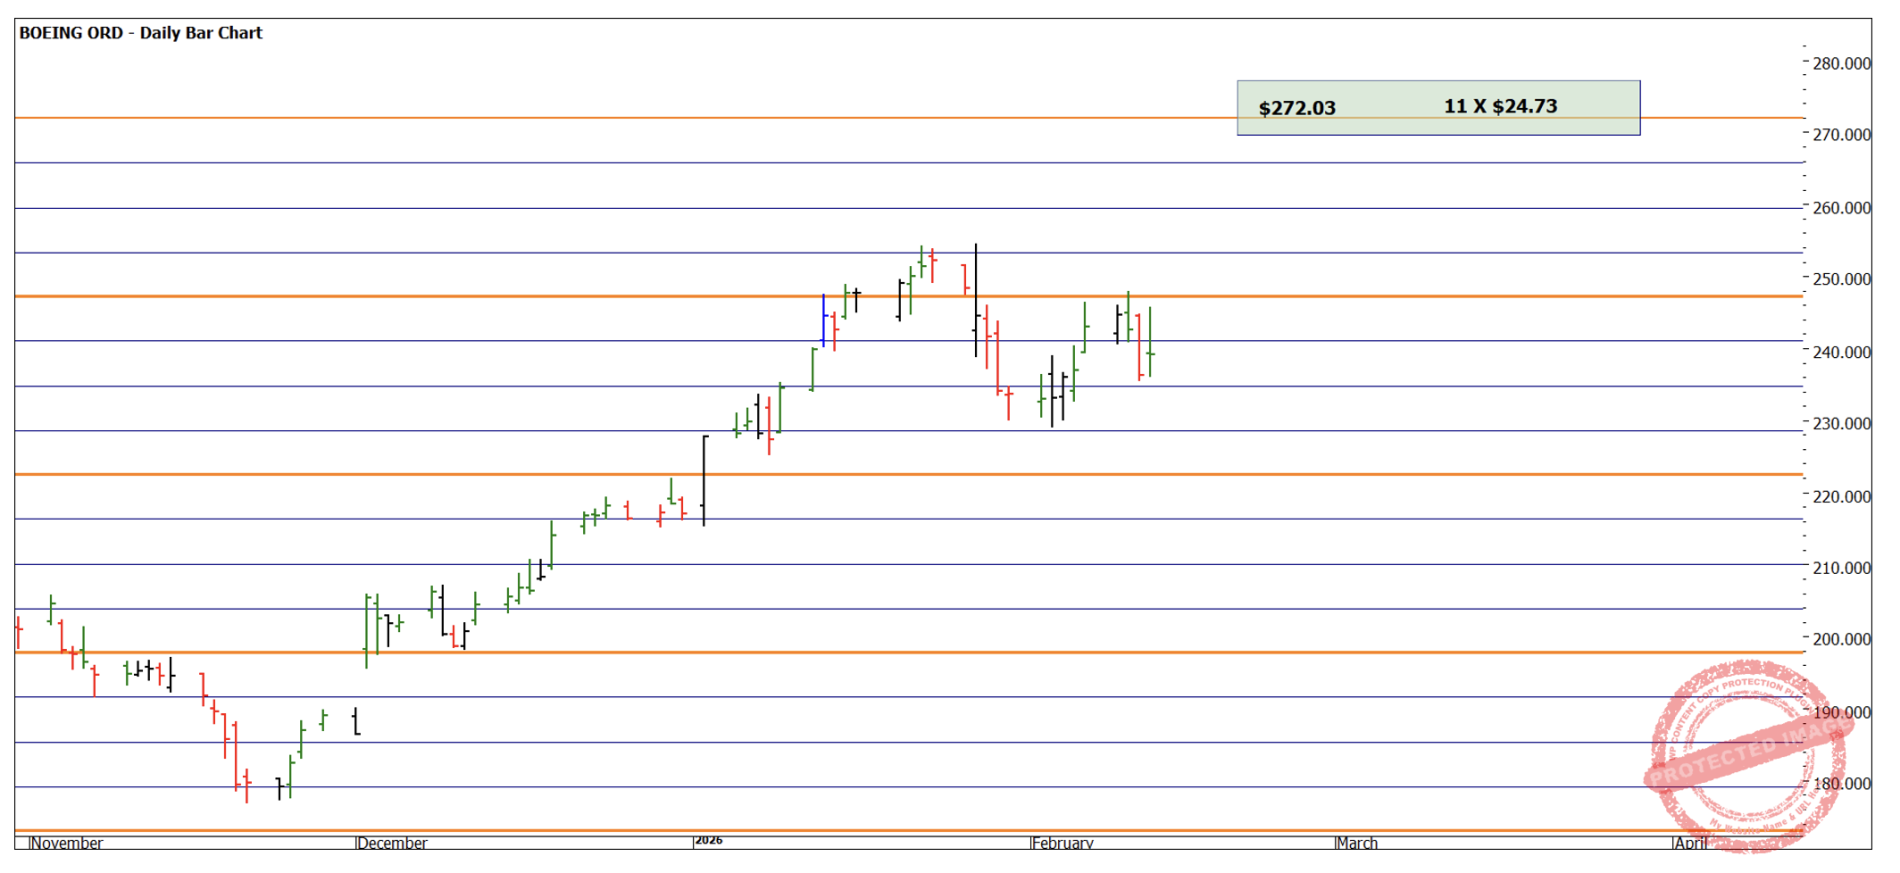
Chart 4 – Daily Bar Chart BA.NYSE
There are two things I wish you to review, firstly add up all the targets and average them into 1 price. This will give us a cluster (target) you can then test other techniques against (repeating ranges, First Range Out, Highs Resistance Cards)
Many would understand the value of Gann’s 50% rule, when setting up Ranges Resistance Cards on the major highs and lows the following was apparent. There is some significant price support below the current price. Charts 5-8 are just Ranges Resistance Cards using the 50% level.
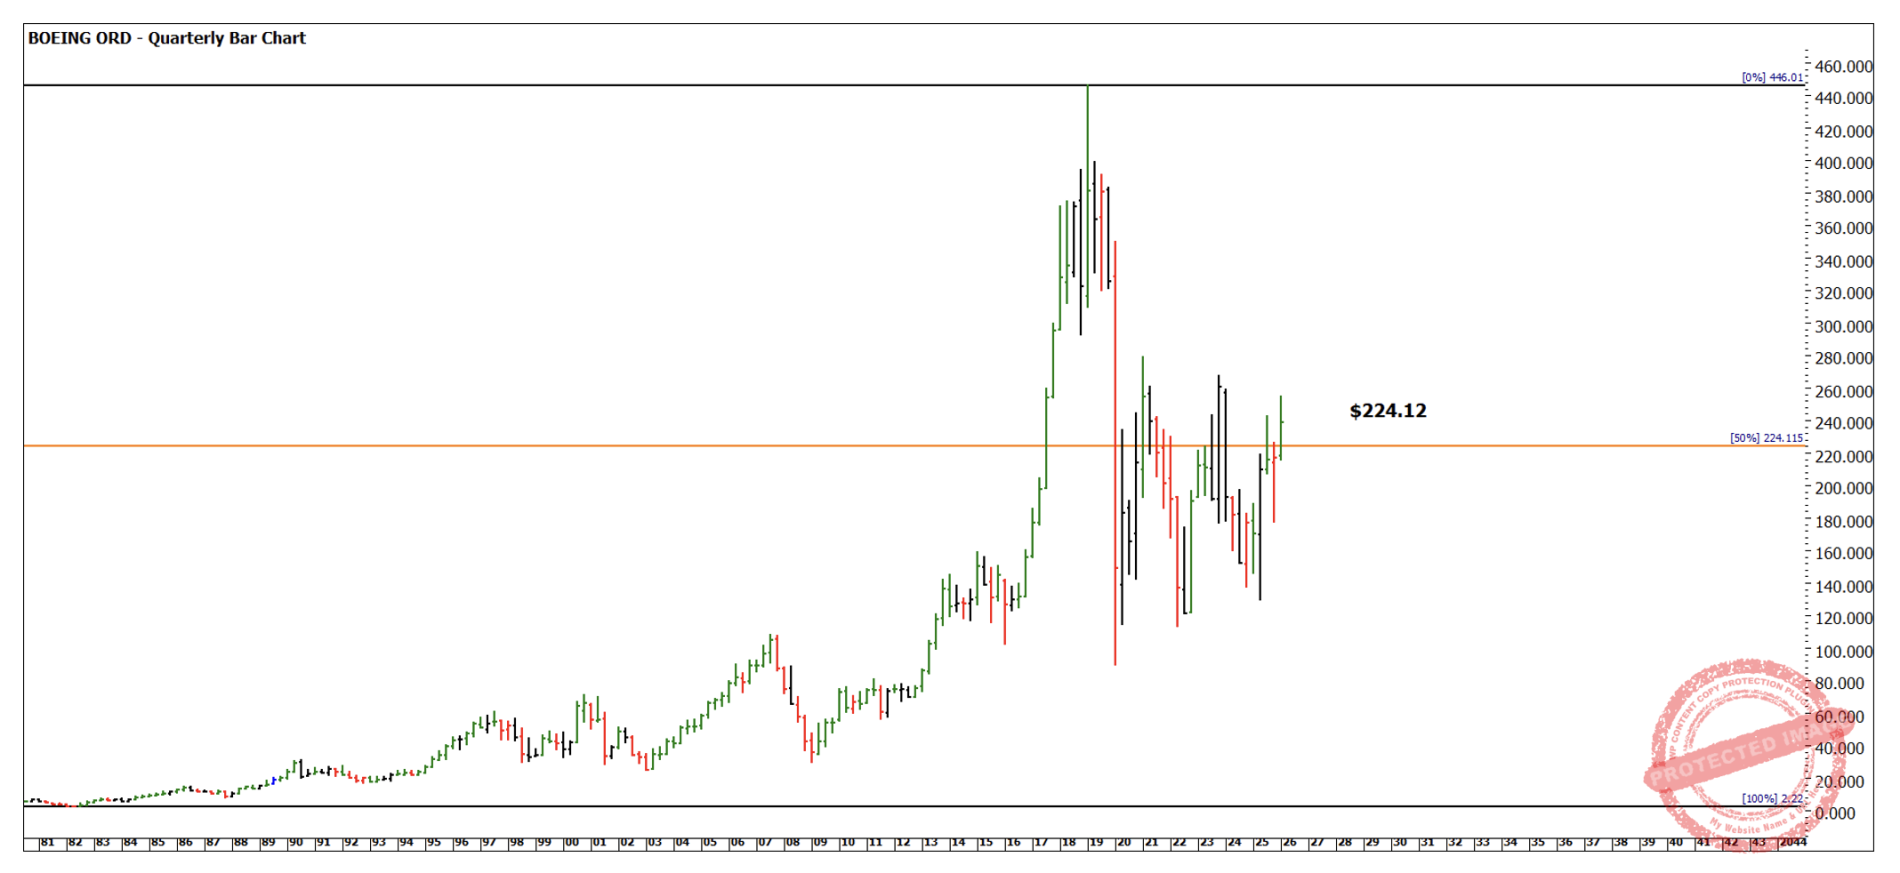
Chart 5 – Daily Bar Chart BA.NYSE
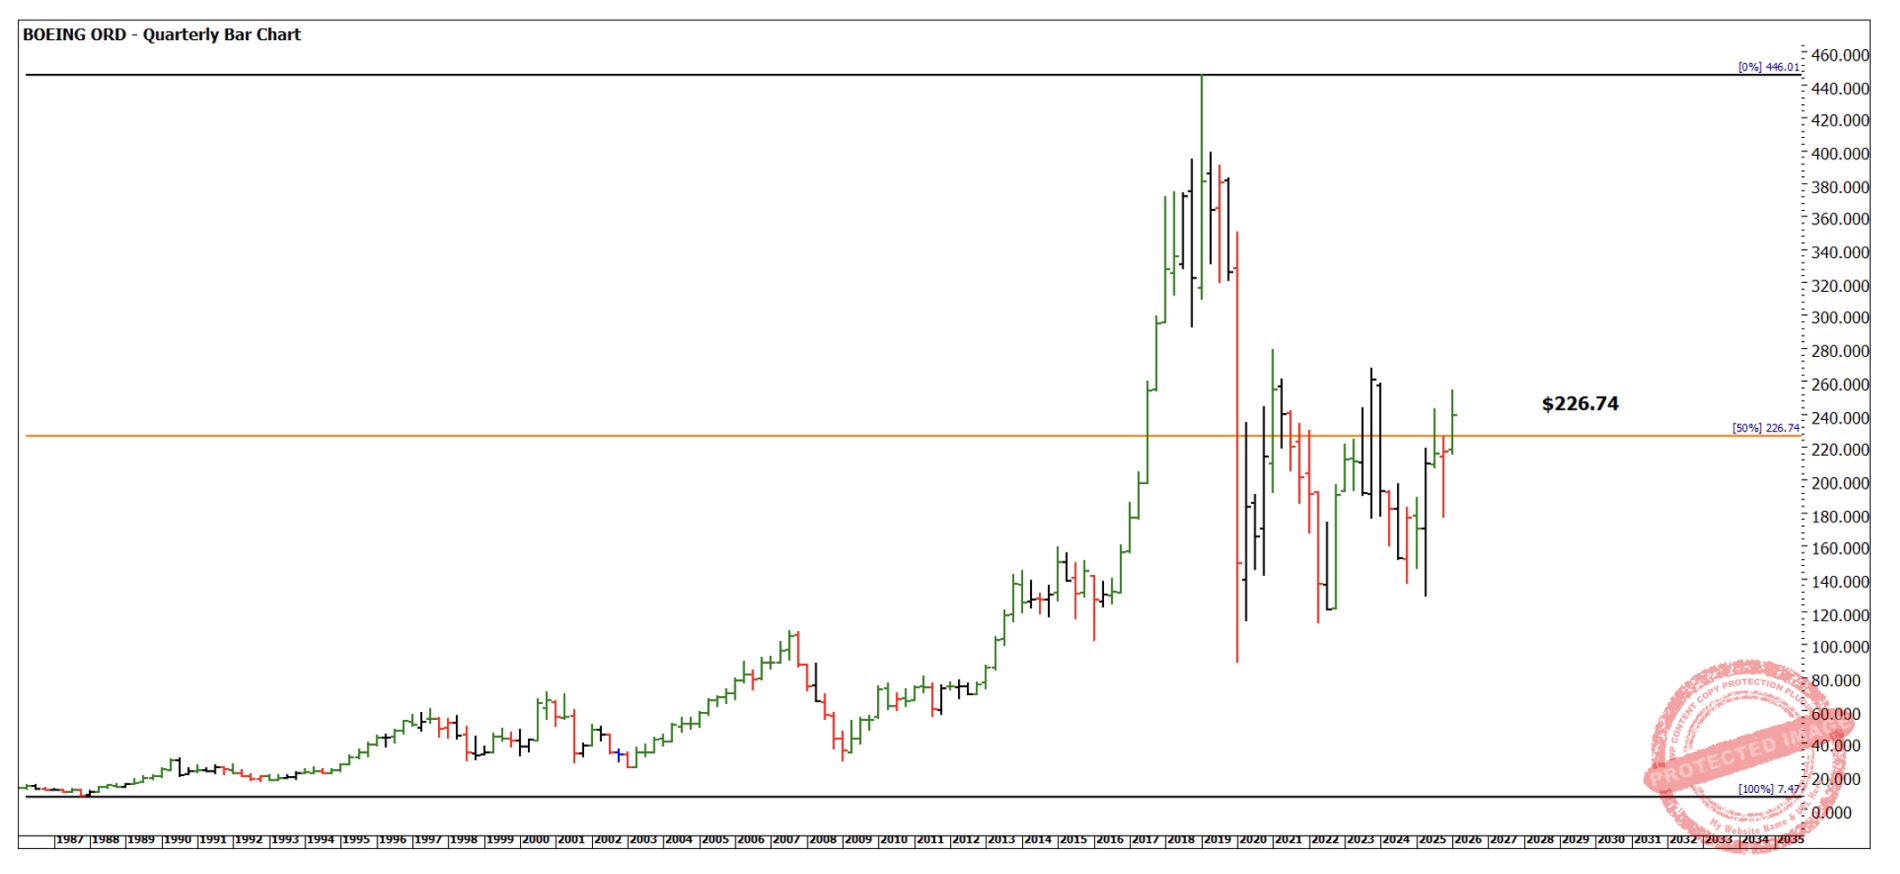
Chart 6 – Daily Bar Chart BA.NYSE
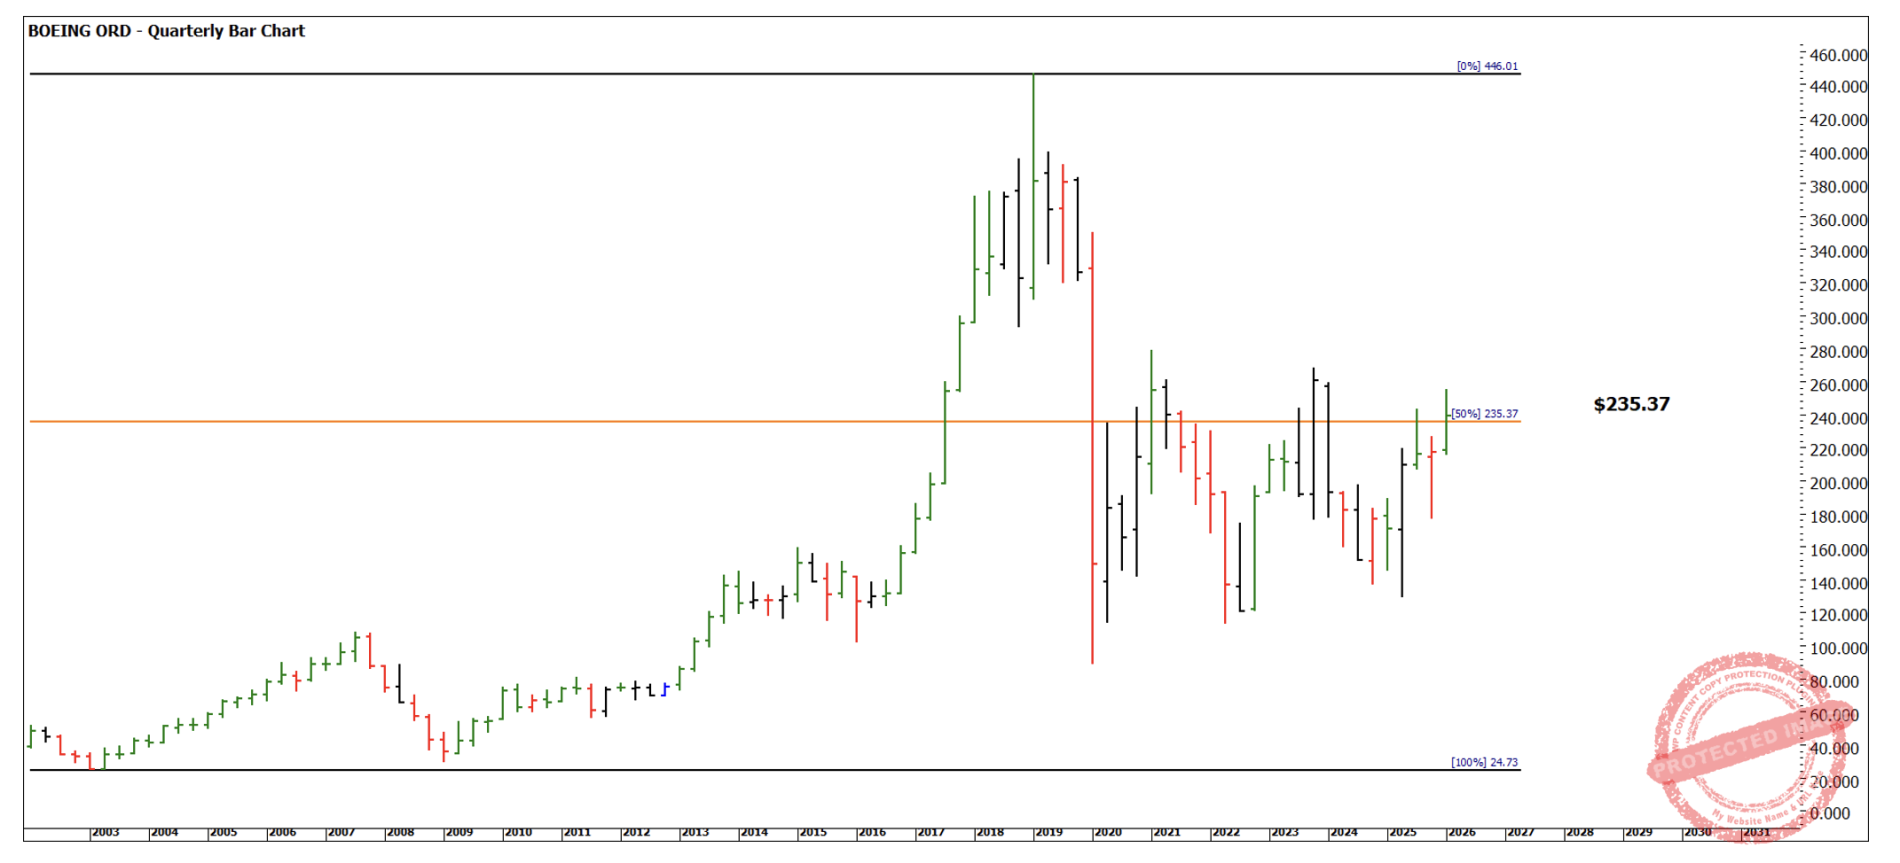
Chart 7 – Daily Bar Chart BA.NYSE
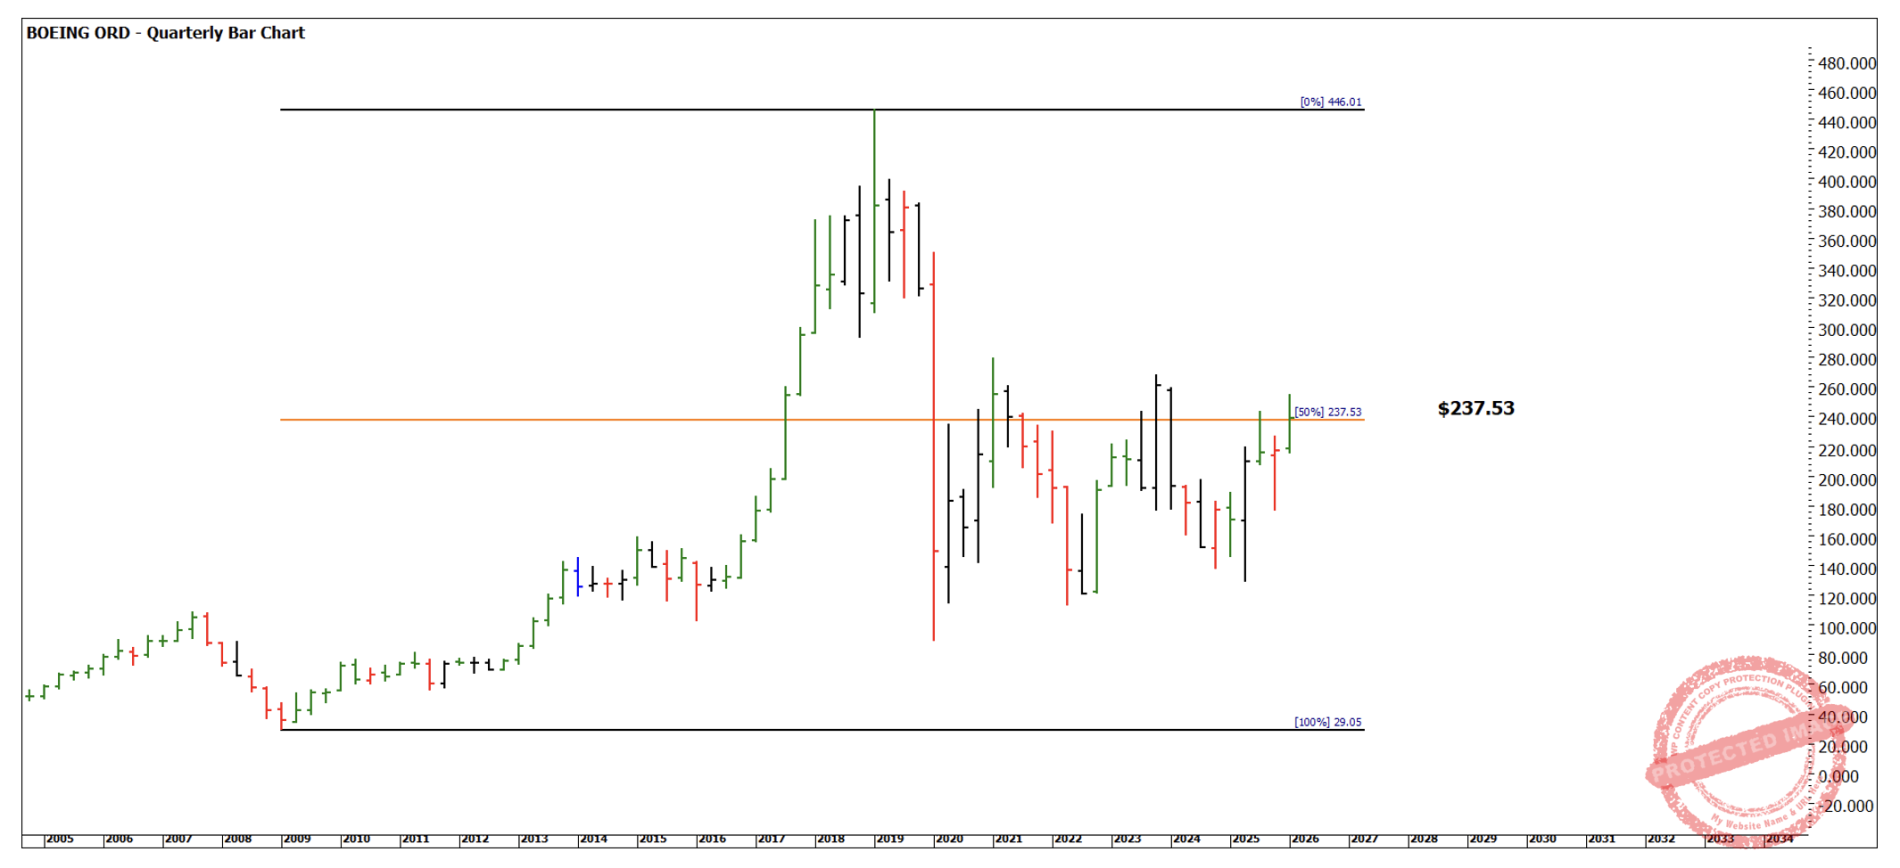
Chart 8 – Daily Bar Chart BA.NYSE
I encourage you to again average the prices and create a price cluster. You should incorporate previous articles on BA to continue with this work.
This may allow us to know which bus stop to catch the next ride from.
Good Trading
Aaron Lynch