There is Always a Headline
Well, how did we get to December so fast! 2024 has been a year of challenges and milestones in my life and to be frank I am looking forward to a reset and a fresh cycle to commence in 2025. We should all be comfortable with the notion that cycles are in place based on a multitude of reasons and they don’t always start and end on a date so clean as the first day on a new calendar year. The headlines this year have been varied and troubling as they covered many challenges for the planet. I am a little surprised about the “ease” of the post US election period in terms of turmoil but there will be no doubt more to come as that new “cycle” of Government commences.
Gold has been a large focus for me this year and I see the top we discussed in October is still in place, we will continue that discussion in 2025 to track the price action and see if that remains or if the existing bullish cycle continues.
A name that is always chasing a headline, Elon Musk, has appeared again for a variety of reasons over the last six months. After a judge ruled on his remuneration package in the negative, he has again captured the media focus. What I find though is that the news or talk will ebb and flow but the underlying basics of cycles, patterns and a robust trading plan will enable enough opportunities to get ahead.
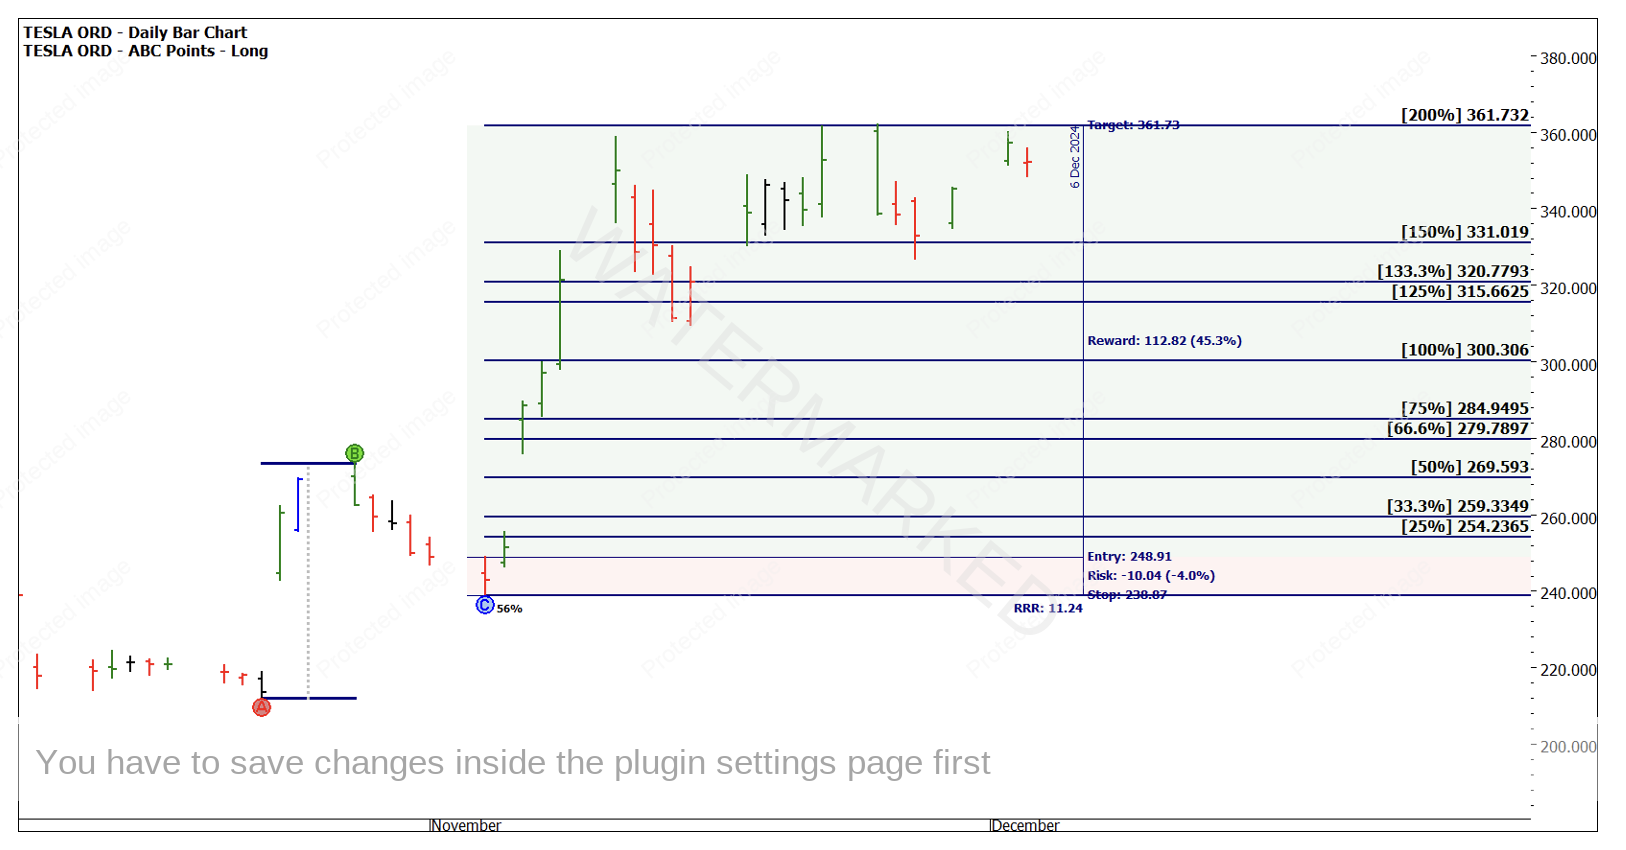
The Tesla company finds itself well placed to participate in the revolution of electric vehicles and so much more. It has found itself well placed in its cycle and in Chart 1 I have labelled the most recent ABC long trade, the simplest of our trading plans with regimented rules for all elements of entry, exit and stop management.
Chart 1 – Daily Bar Chart TSLA.NASD
As mechanical trading signals go this was a good one, however, the mechanical setups have to be hunted for in the places in which they can be best placed to deliver. This particular set up, if managed to 200%, delivers an approximate 11 to 1 Reward to Risk Ratio. Imagine if this was your first ABC trade?
You might be thinking, if I take a simple pattern I can retire next week!
Remember though, there is always another trade like this out there, another headline and also another mechanical pattern that delivers the exact opposite. We have to unearth these opportunities with bigger harmonies to fuel a move like this.
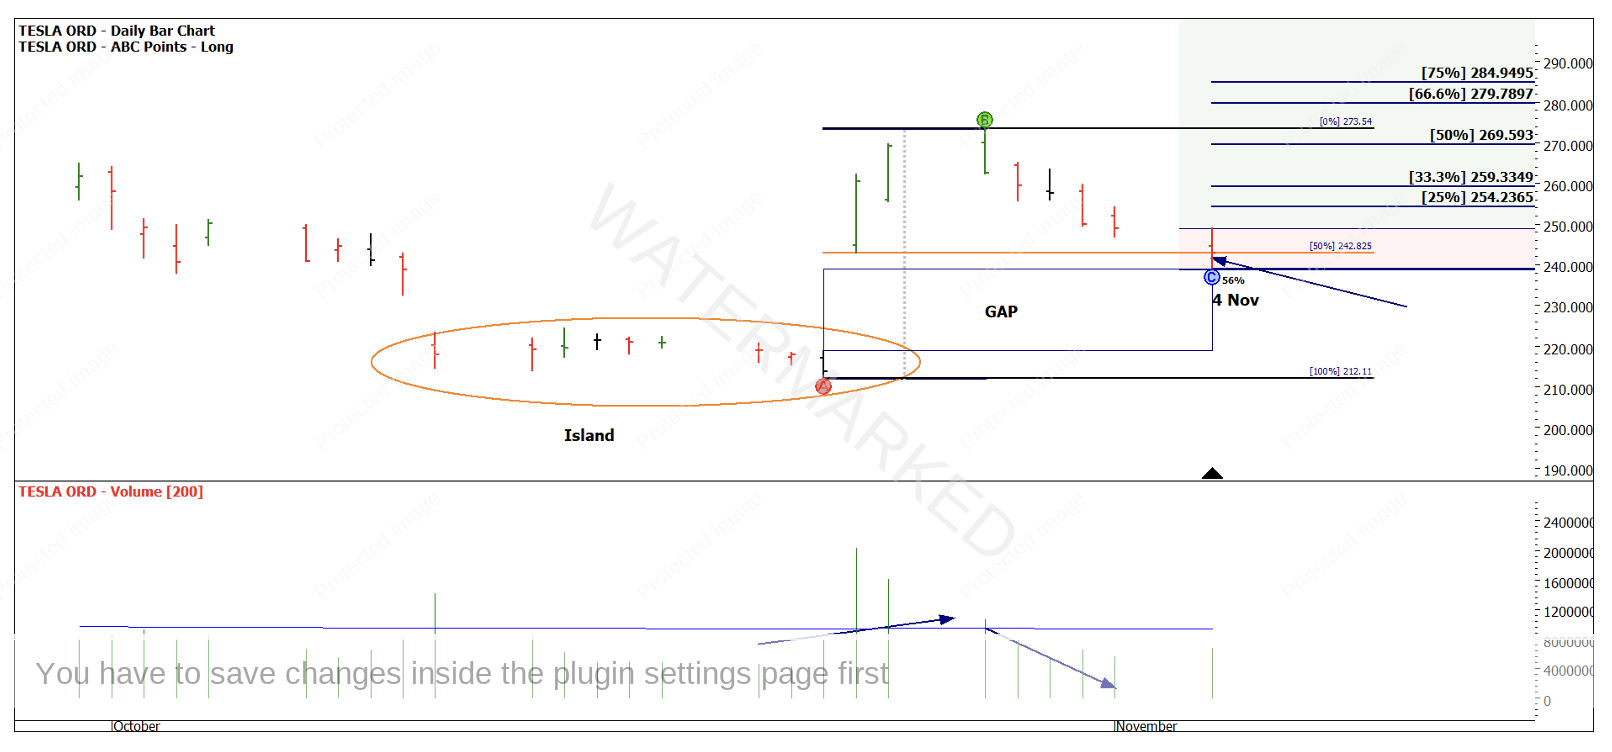
Chart 2 shows a number of first dimension aspects like the 50% pullback, with low volume from B to C. Point A is sitting in an island of lows and the market has gapped from A to B to create a nice gap that the market has not filled.
Chart 2 – Daily Bar Chart TSLA.NASD
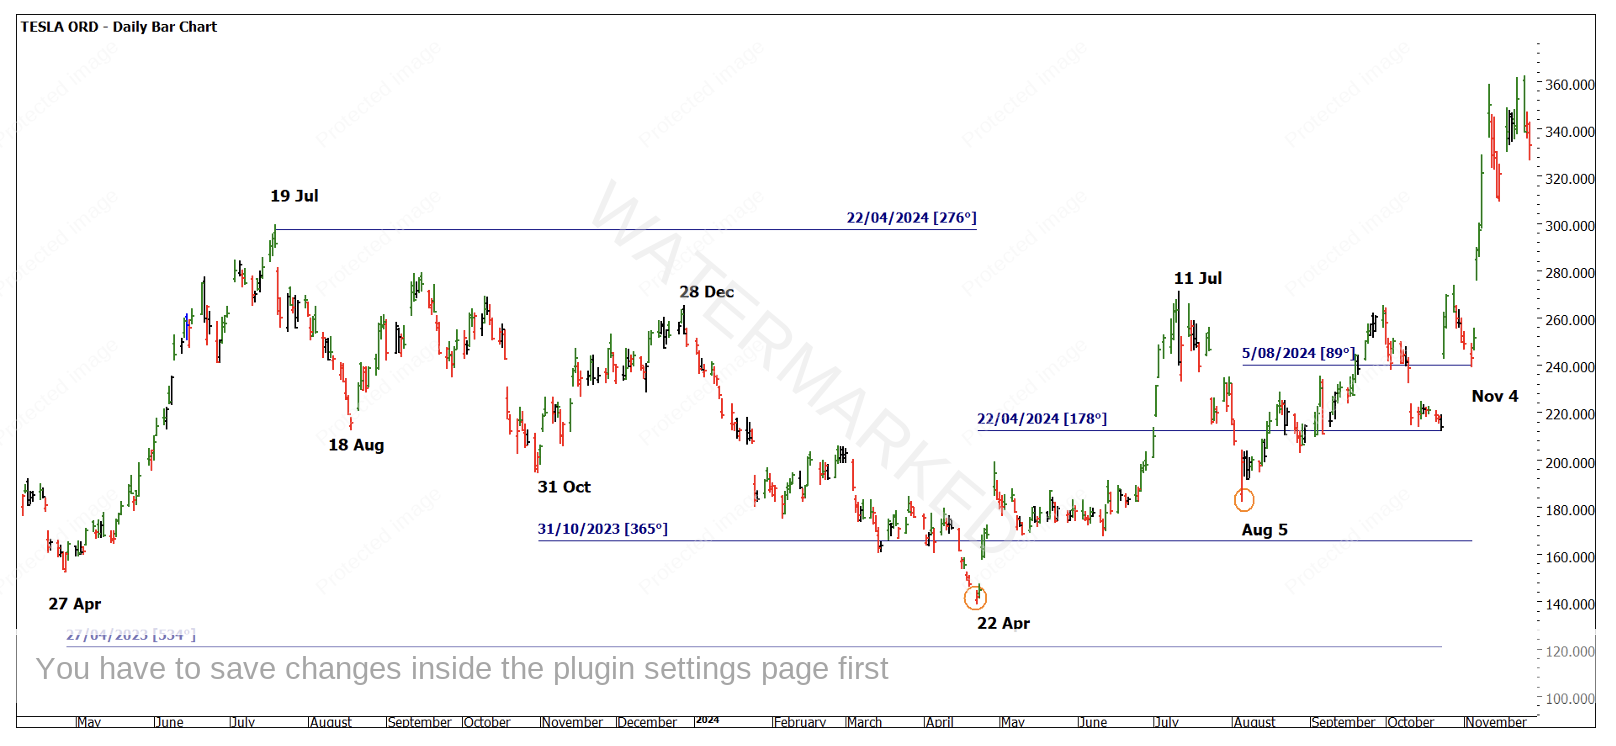
Point C is very close to a seasonal time, and we can tune this up with our Time by Degrees to feel more comfortable.
Chart 3 uses several reference points with anchors for Time by Degrees analysis. A common myth would be to explain away the quarterly turns due to earnings, however, if you check this independently there is not a direct correlation.
Chart 3 – Daily Bar Chart TSLA.NASD
We can lean on first dimension tools as well by understanding retracements etc.
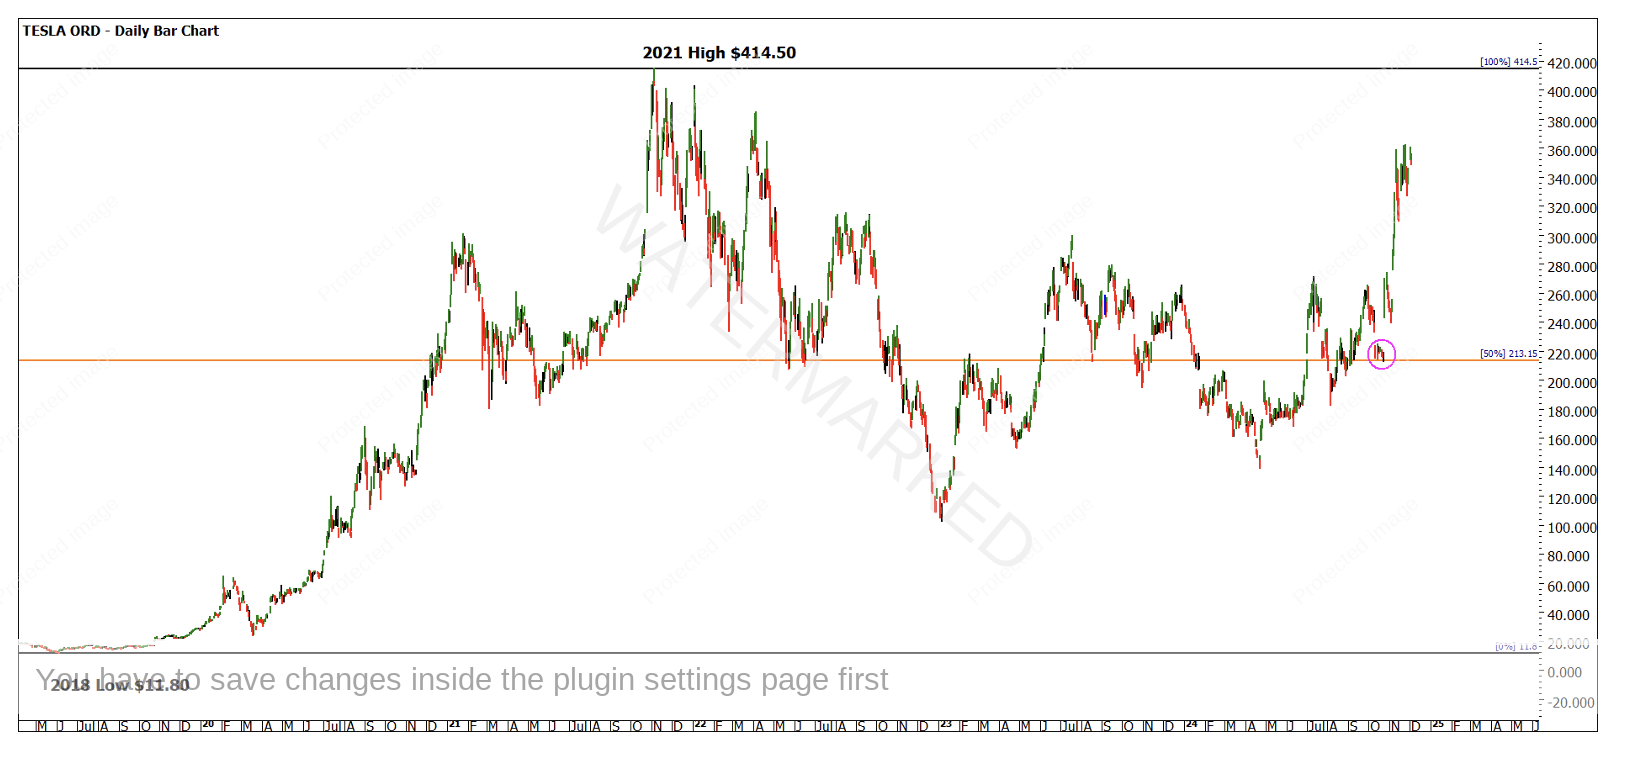
Chart 4 uses the 2018 low and the All-Time High as a Ranges Resistance Card and the 50% level supports Point A of the recent ABC setup.
Chart 4 – Daily Bar Chart TSLA.NASD
The next challenge for you to undertake over the upcoming end of year break is to break down some time frames that the market provides you. By measuring time frames between tops and bottoms we can start to understand the rhythm that price likes to operate in.
The time frame from the 2018 low to 2021 high is 885 days. Using this in a variety of areas post the 2021 top would have allowed for you to anchor and validate some important turning points.
No doubt this example and others will creep into Ultimate Gann Coaching next year as I look forward to returning to instructing traders in their pursuit of success. The only headline that I want to lean into is that there has never been a better time for being a trader!
Good Trading
Aaron Lynch


