Time to Correct the Monthly Swing?
Continuing on from last month’s Safety in the Market newsletter, Trading with the Trend Continued, I was stalking the Dow Jones for a Weekly ABC setup. My approach is to enter as close to Point C as possible, using a 4‑hour or 1‑hour swing chart, and aim for the 100% milestone of the weekly A-B range. What I love about this setup is that it aligns perfectly with David’s rule: always trade with the main weekly trend.
Looking back to the 7 November low of 46,574, the question is whether this satisfies the five elements of a Classic Gann Setup.
As for ‘Time’ Friday 7 November was a seasonal date, with the Sun at 14°49′ in Scorpio. The 10 October low was also close to 15°, though slightly later at 16°56′. Over the past year, there haven’t been many turns at the 15° seasonal time. But notice how, 30° prior to a potential Point C, the market turned? I’ve seen this pattern before – the market seems to pivot at a “random” point, only to set up a bigger turn 30, 60, or 90 degrees later. It’s almost like the market whispering: wake up, something’s coming.
We also had a neat 50% time retracement: 19 days up, 9 days down. Beyond the indices forming higher weekly bottoms, my time analysis extends to larger cycles. I can see correlations with both the 20‑year and 100‑year cycles, which guides my general direction of the market for now.
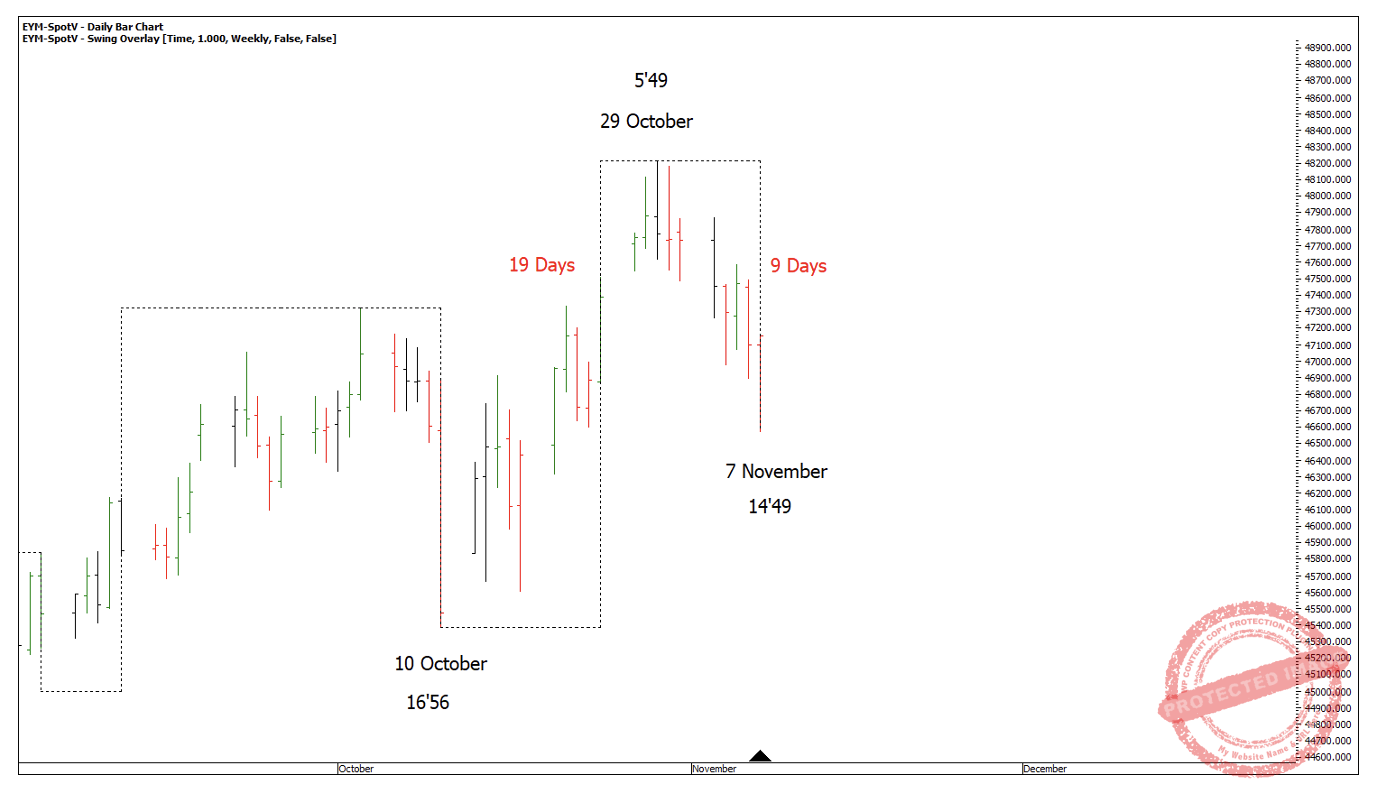
Chart 1
To satisfy ‘Price’ and ‘Position’ we had:
- A Weekly Point C on a 50% price retracement
- Three daily sections down
- 150% of the First Range Out clustering with
- 100% daily repeating range into small double bottoms
- Point C roughly finding support on an old weekly swing top
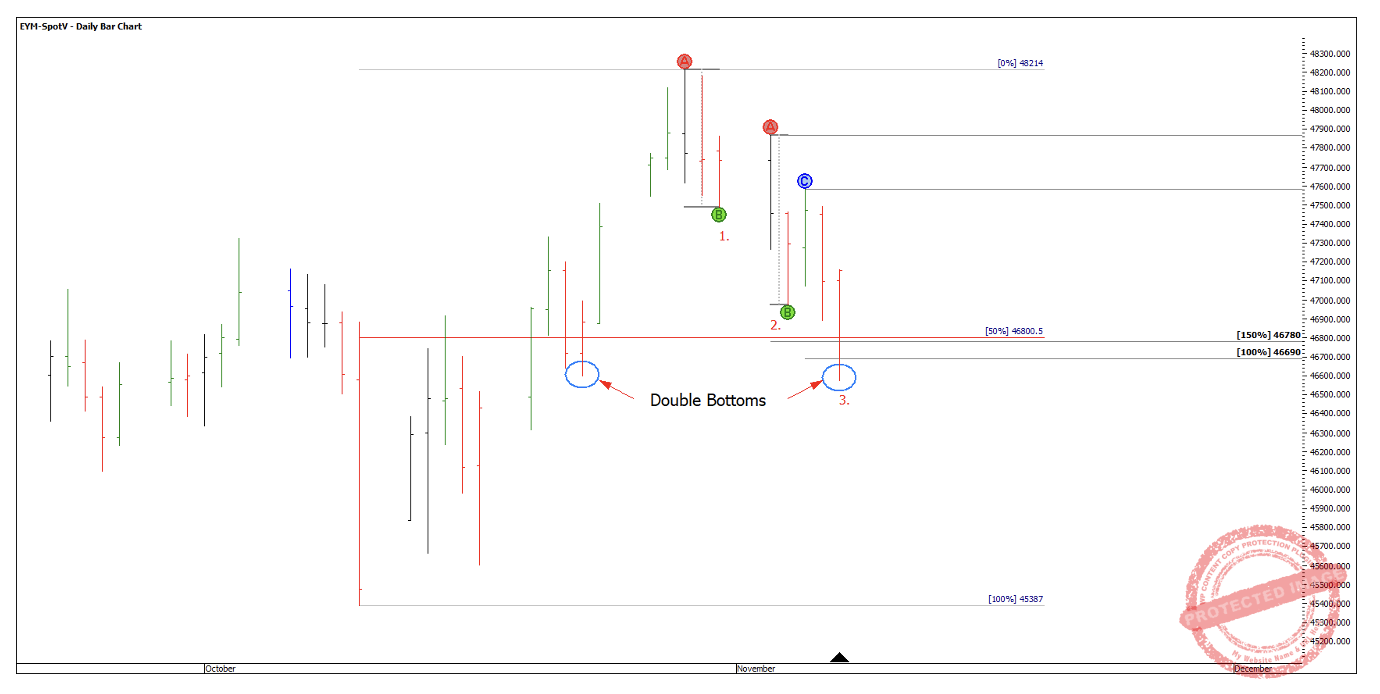
Chart 2
Is this setup strong enough to justify a trade? Does it meet your criteria? For me, 3-4 sections into a 50% retracement is a fantastic place to start! However, a trade must still offer a high reward‑to‑risk ratio. That’s why entering on a 4‑hour or 1‑hour swing chart out of Point C can deliver double‑digit returns, even if you don’t hold for the full 100% repeat of the weekly A‑B move.
Looking at the last daily swing down into the cluster with a 4‑hour bar/swing chart, we can ask:
- Does the 4‑hour chart add signs of completion?
- Do extra price milestones strengthen the cluster?
- Is there a low‑risk entry?
The last daily swing down consisted of three 4‑hour sections, with the third extending to 200% of the 4‑hour First Range Out.
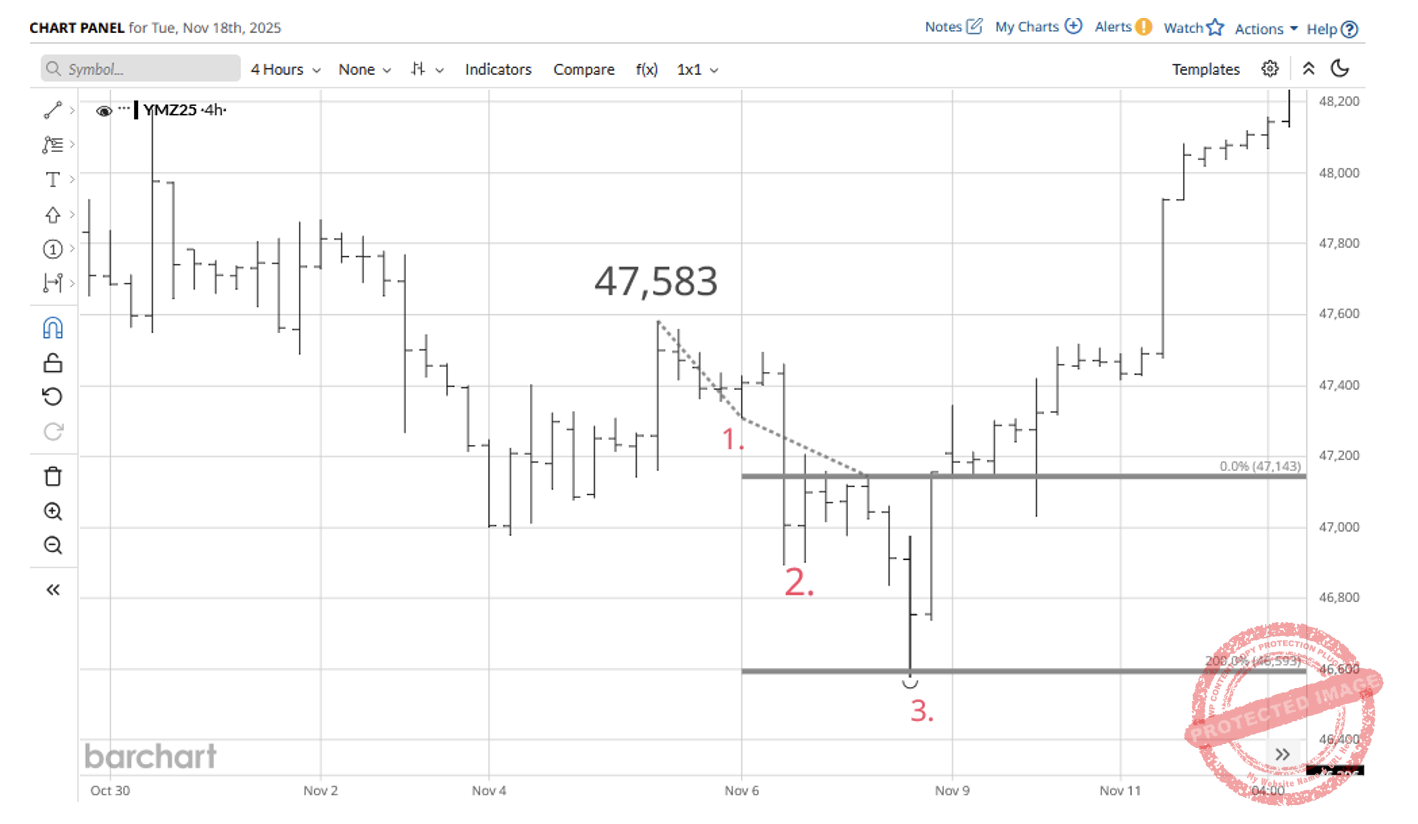
Chart 3
On a 1‑hour chart, the final 4‑hour swing showed a repeating range into the low – exactly to the point. When a market trading around 46,000 points delivers a 1‑hour repeating range to the tick, that’s pretty remarkable.
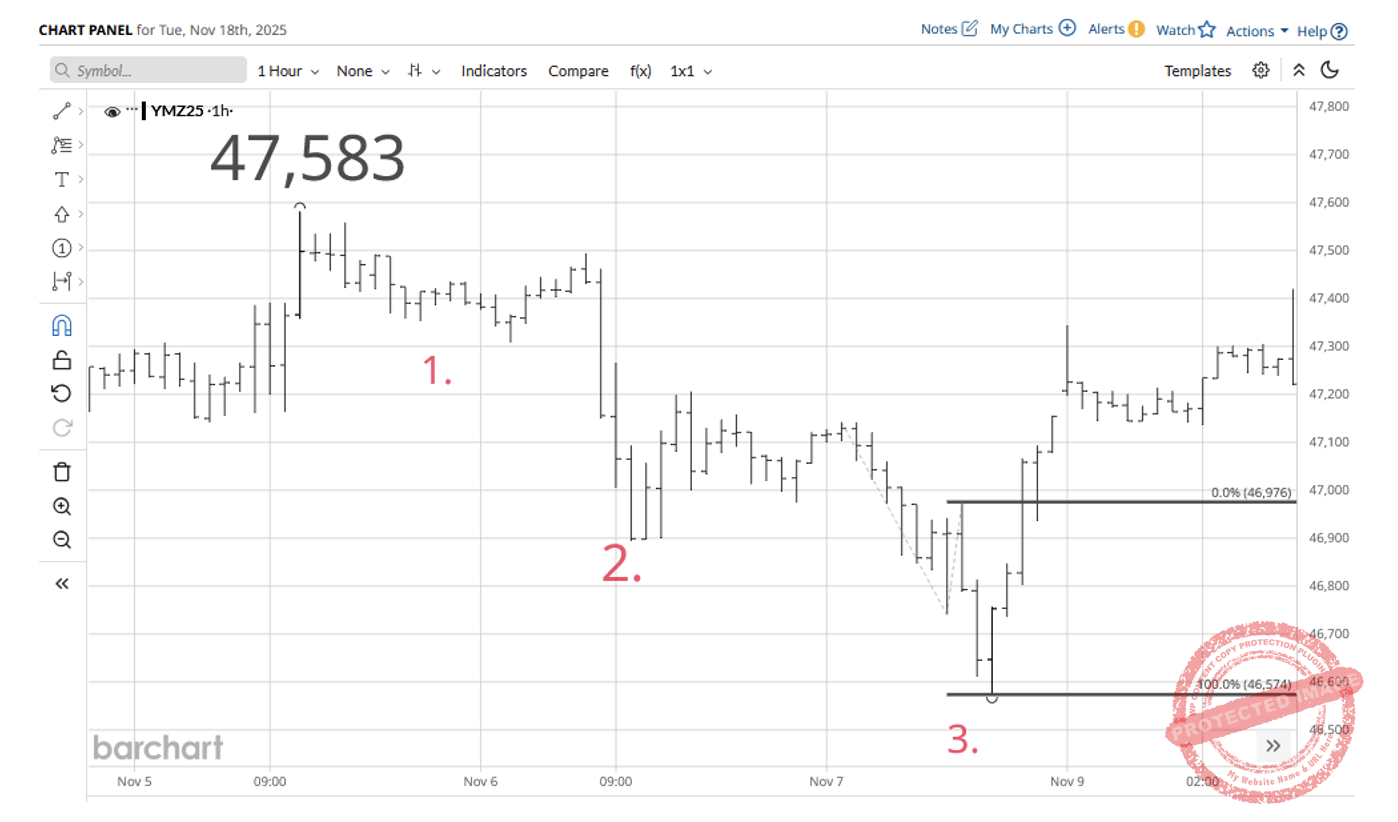
Chart 4
However, the 1‑hour bar that marked the exact low had a range of nearly 200 points. To achieve a 10:1 return, the market would need to move at least 2,000 points from entry. The weekly C‑D range launched strongly but faded before reaching 75% and has now tanked back through the original weekly Point C. It’s a reminder that we don’t control the market. Curveballs are inevitable. What we can control are our emotions, entries, and our stop management strategies.
For another setup, revisit last month’s Platinum newsletter to see how that weekly ABC short trade came together and how it’s now progressing.
Happy Trading,
Gus