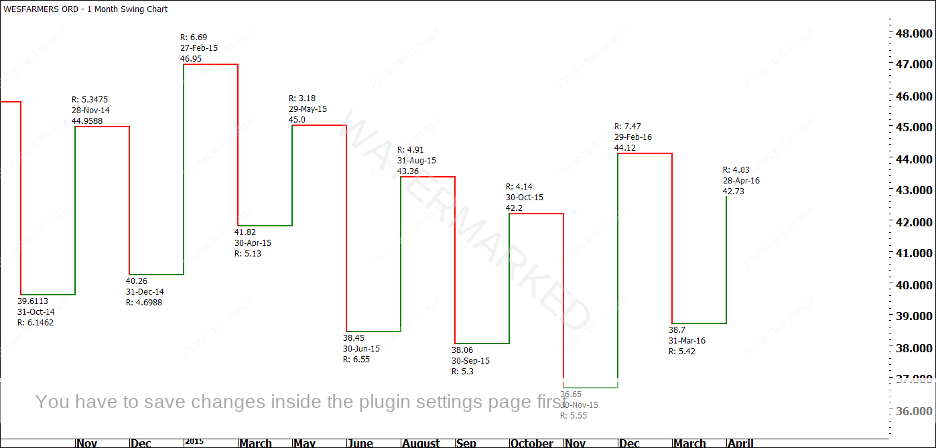
At the time of writing (end of April, 2016), the answer to “which Range are we in?” can be summed up neatly by one simple chart – the monthly swing chart!
Chart 1
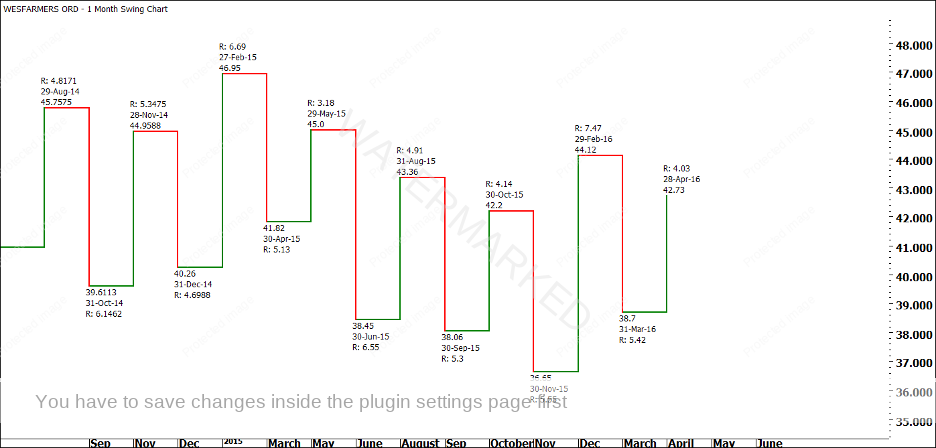
Look closely at the monthly swing chart ranges in Chart 1, above. The first range down from the 23 February, 2015 high was $5.13. Interestingly, this is approximately 2 x 256 points, the range from David’s example in The Number One Trading Plan!
The second swing down was $6.55 – an expanding range, which is usually to be expected for Section 2. The third range is $5.30, less than Section 2, but slightly larger than the First Range of $5.13. Section 4 is $5.55. Although this is an expanding range compared to Section 3, you would be on alert for a major low by this stage of the game. Gann says that “in many cases”, Section 3 is “the end of the campaign”, however he calls Section 4 “the most important to watch for the end” of a move. Later, we will do some work to determine if this was a Classic Gann Setup and, more importantly, if we could have made money from it.
Before we move on, I’d like to take a quick look at the breakdown of the First Range Out of $5.13, because it is not always so clear while the market is still unfolding. The First Range Out appears to be made up of two smaller sections. We can see this more clearly on a bar chart with the “2 Weekly” Turning Points layered on, as seen in Chart 2 below.
Chart 2
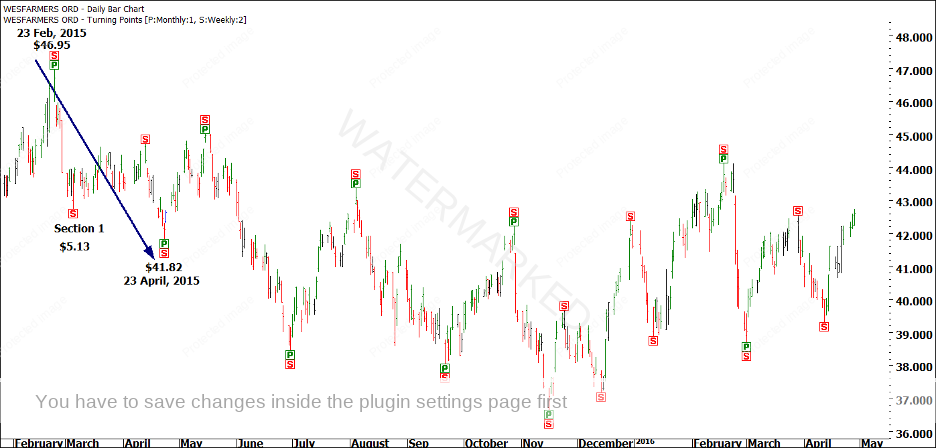
In real life, it would have been reasonable to think that the run down to the 5 March, 2015 low was in fact the “real” First Range Out. You may have even traded short out of the 13 April, 2015 top, as shown in Chart 3 below.
Chart 3
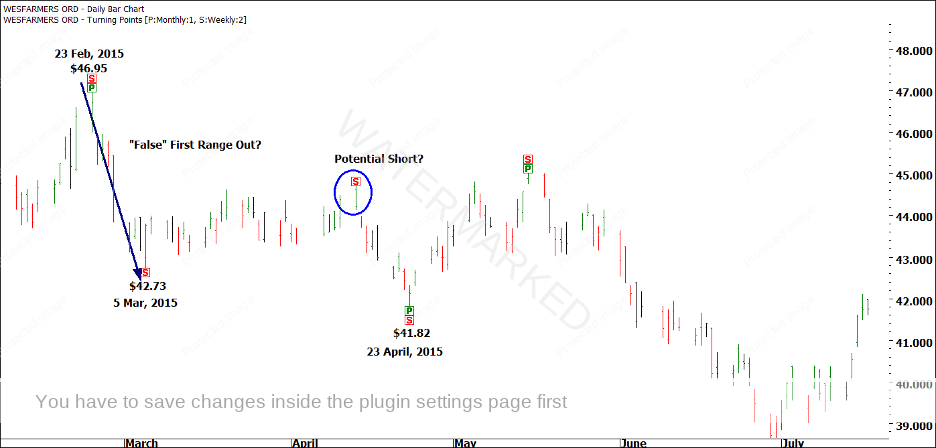
During a move that lasts for four sections, there will often be at least one range that gives you some trouble. In this case, the First Range Out was a tough one to nail down. However, it is unlikely to have cost you any money. Had you traded short out of the 13 April top, you would have seen three contracting daily downswings of $1.60, $1.29 and $1.28, before a gap up, as shown in Chart 4 below. You would also have noted that the market ran 200% of the 20 March and 13 April, 2015 Double Tops!
Chart 4
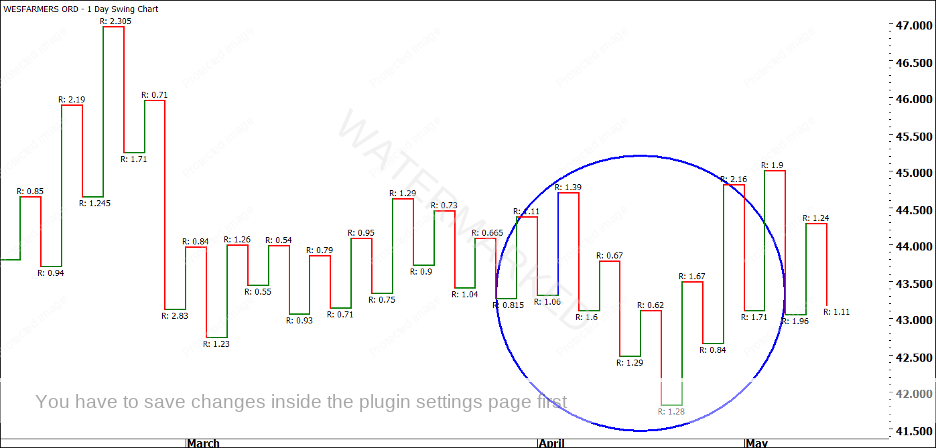
Contracting down swings running into a 200% milestone from Double Tops should have given you a clue that all was not right with your short trade. If it didn’t, the gap up should have gotten your attention. On 5 May, the April high was broken, turning the monthly swing chart UP, and confirming a monthly First Range Out of $5.13. From there, we know that we had four clear sections down on the monthly chart.
Keep in mind that the sections of the market are not always visible on the monthly swing chart. They might be clearest on the 3 day swing chart, or the weekly swing chart. In the long term, maybe the quarterly or yearly chart will give the clearest picture. This is why it is important to keep on top of your swing charts.
Let’s go back to our monthly swing chart now. After the November, 2015 low, we had seen four sections. We would be on the lookout for an “indication of a change in trend”, such as breaking a swing top, or an Overbalance in Price on the monthly chart.
Coming out of the November, 2015 low we had a monthly swing range of $7.47, which was 1.8 times the previous monthly upswing of $4.14. While I prefer to see 200% before I call a range an Overbalance in Price, I’ll settle for an “Expanding Up Range” if it occurs after 4 sections to the downside.
After the Overbalance in Price, right when people would have been starting to say “buy Wesfarmers”, the market did what it nearly always does and attempted to get back down to its low. This is called the “re-test”. As we saw in the Price Forecasting Webinar, one of the places to watch for the re-test to “fail” is 100% of the last section down. As you can see in Chart 5 below, WES only managed $5.42 to the downside for its re-test, slightly less than the previous range of $5.55 before taking off again.
Don’t be fooled by a Retest of the low after an Overbalance in Price. No one rings a bell and announces that the low is in. At this stage, people would still be in “bear mode”, with most not expecting the market to rally.
Chart 5
That sums up our ranges work on Wesfarmers. We have seen four clear sections down from the February, 2015 high, followed by an Overbalance in Price to the upside (signaling a new bullish trend), and a failed re-test. For the time being, Wesfarmers is in an uptrend on the big picture monthly chart. Because the market has given us a First Range Out ($7.47), we can project this range forward, as shown in Chart 6 below.
Chart 6
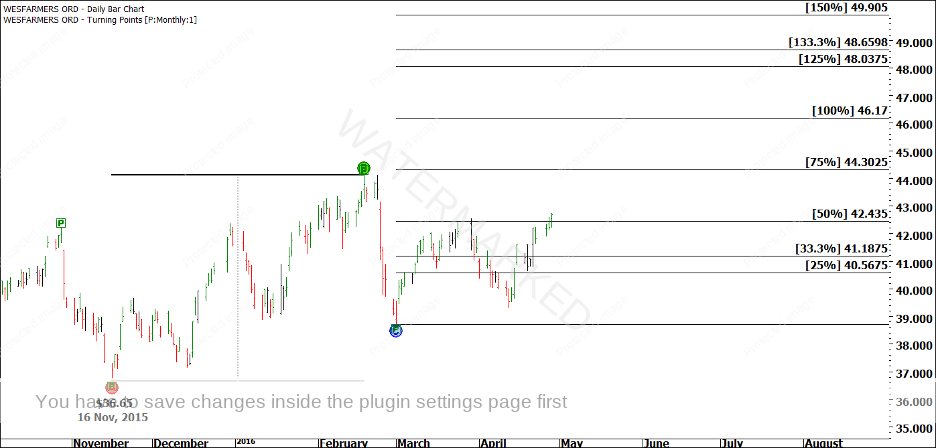
At time of writing, WES had touched the 50% milestone of this range, fallen away, and then come back to close above the 50%. So far, there is nothing that suggests anything but upside for Wesfarmers. You may like to treat the run up from Point C in Chart 6 to the 50% milestone as your First Range Out on a smaller scale, and project this range forward as well, looking for a second and possibly third section, as shown in Chart 7 below.
Chart 7
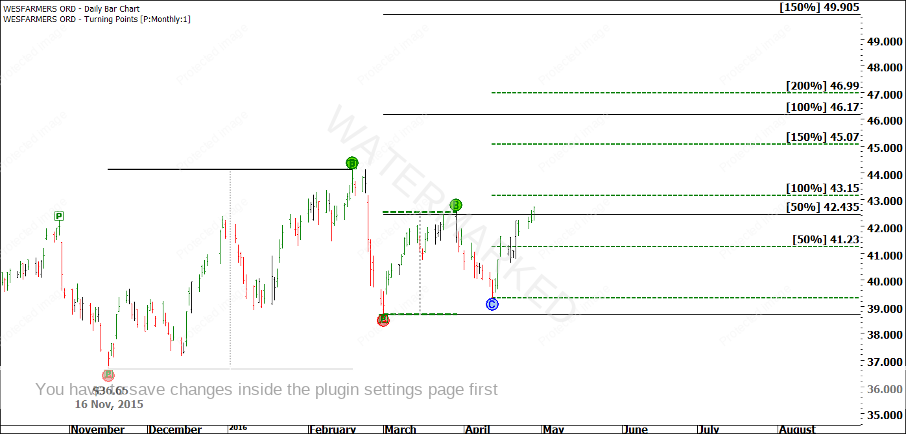
To make things clearer, I have only shown 50%, 100%, 150% and 200% multiples. I have shown the smaller ranges in “green dashes”. Keep in mind that the big picture shows every sign of reaching the 100% target of $46.17 (based purely off the monthly swing chart). IF it is to do that, then you would expect three, perhaps four smaller sections, based on the smaller First Range Out.
In my final chart, Chart 8, I have run a theoretical projection, which is pure speculation at this point. I have assumed a second small section of 133%, followed by a pullback that is roughly equal to the pullback after the first small section. From this “imaginary” Point C, another 133% range (meaning that sections 2 and 3 are equal) would take us to around 100% of the large range.
Chart 8
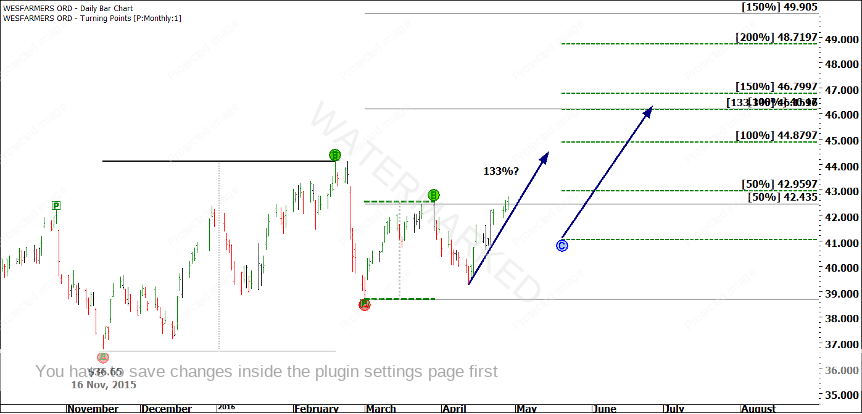
Confused? Don’t worry! We know that at the end of the day, we will be able to look back over a period of the market (as we have just done) and clearly label our sections. All I am trying to do is show you how to piece the market together as it is unfolding. Remember the concept of wheels within wheels. Apply your ranges. Look to see where milestones line up together. You may like to have a look at Case Study 6 now, which deals with “sections within sections”.
There are several ways in which the Ranges could unfold – maybe WES will do four small ranges, or maybe only three. Maybe, WES will fail in this second range and that’s the end of the up move. Your job as a trader is to watch the ranges, watch the milestones, and look out for potential “Culmination Points” lining up together, such as 100% on a small range and 100% on a large range. Culmination Points are explored further in Case Study 7.