(i) 23 February, 2015 High
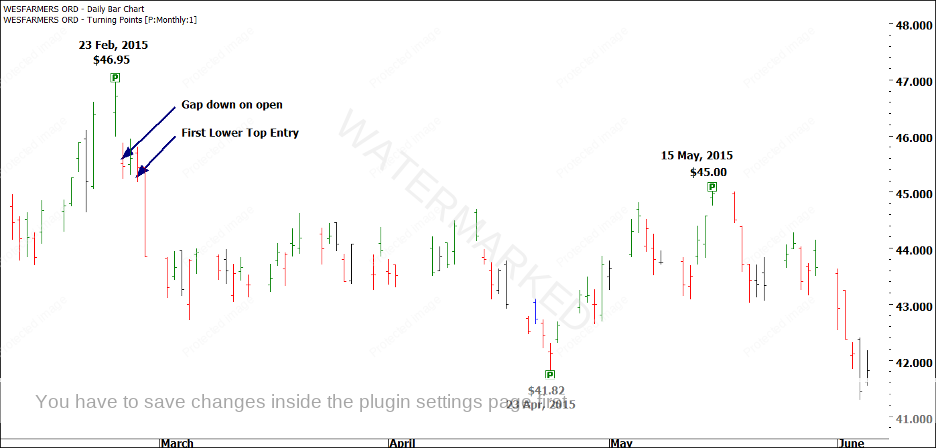
The reasons for this top are covered in Case Study 2. In Chart 1 below, you can see that this was a difficult move to trade, initially. There was no Short the Closers entry on 23 February, the day of the top, and the next trading day saw a large gap down.
Chart 1
If you were planning to enter as the daily swing chart turned down on 24 February, you may have received a small shock when it gapped down by 2.5%. You still could have gone short, with a stop loss above the high of 23 February, but your risk would have been larger. These are the sorts of decisions you need to make quickly on the day. The other option is to wait for a First Lower Top entry, which we saw only a couple of days later.
The question of a profit target is one that every individual trader will have to make for themselves. It comes down to whether you think the 23 February, 2015 top is a final high, or just a weekly or monthly high. If I think a market has made a major high (or even an All Time High), I am more than happy to just let the market unfold for a few weeks after I have entered, watching to see how the sections play out. Once a market has run three sections, I watch for an indication of a change in trend.
We have previously discussed that the First Range Out of $5.13 was difficult to trade, or at least, it would have been difficult to capture the entire move. David says in his Ultimate Gann Course that he was happy if he could capture 50% of each main move with the trend. In order to achieve that here, you would have needed to hold on to your trade during the mostly sideways movement in March and early April, 2015. Again, if you are confident in your analysis of the February 2015 top, then holding the trade longer is less difficult.
(ii) 23 April, 2015 Low
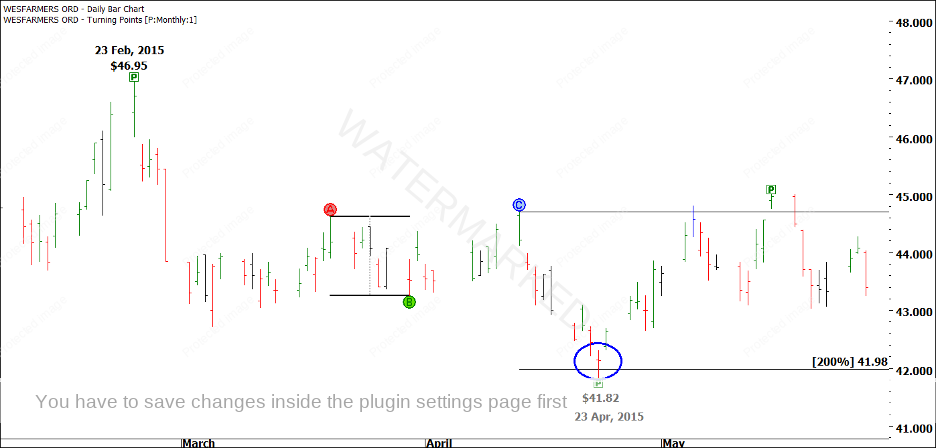
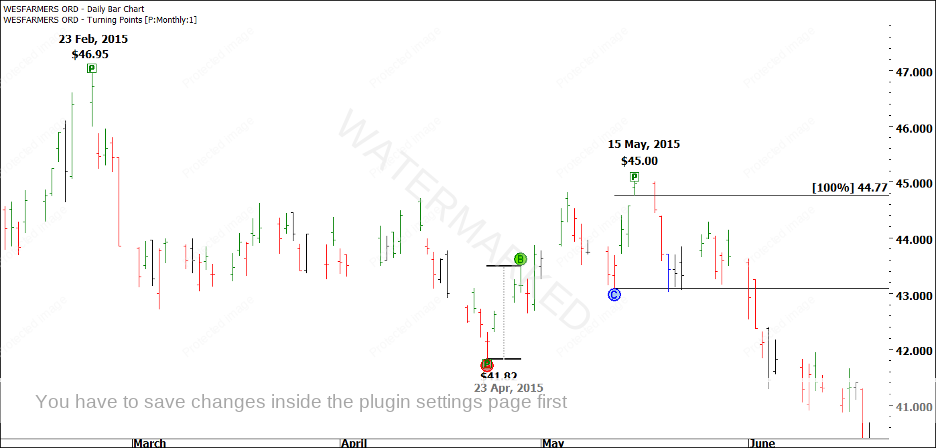
This low came at the end of 200% of Double Tops, as shown in Chart 2.
Chart 2
You may decide that you will stay out of the market and have a rest – and this is certainly a highly recommended option. Gann says that twice a year, traders should close out all of their positions and take a month off to rest the body and the mind. If you decide that you would like to go long here, keep in mind that although there is potential profit on the table, you are basically trading against the main trend. You are trading a BC pullback, which is not where we normally trade.
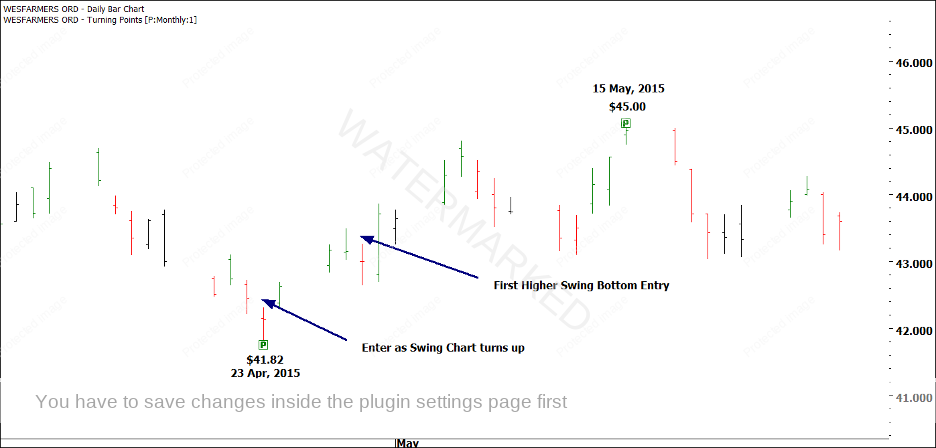
Having said that, we will still look at both options, as shown in Chart 3 below.
Chart 3
The market gapped up on 23 April to a price of $42.38, turning the daily swing chart up as it did so. An entry at $42.38 with a stop loss at $41.81 (one cent below the low of 23 April) would give you a risk of 57 cents per share. To achieve a 3 to 1 Reward to Risk Ratio, WES would need to rise to a price of at least $44.09 (57 cents x 3 = $1.71. $1.71 added to our entry of $42.38 would be $44.09). You can see that Wesfarmers rose to $45 on 15 May, meaning that a 3 to 1 Reward to Risk Ratio was possible. But was it a good idea at the time?
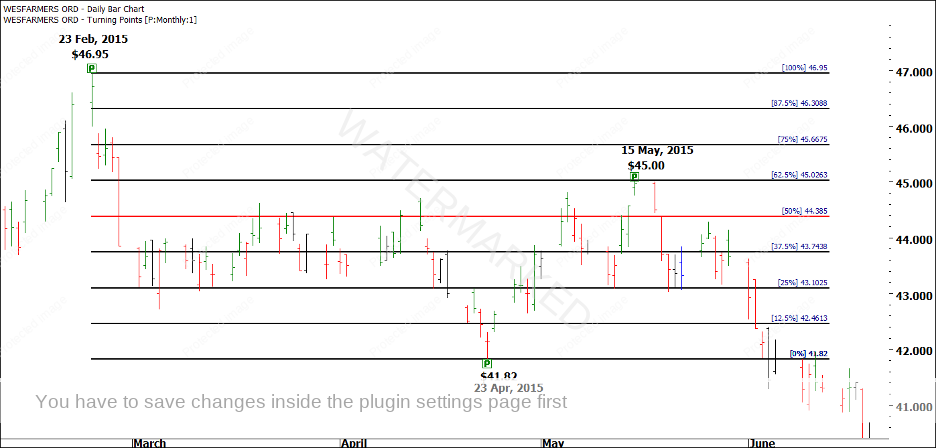
In Chart 4 below, you can see that the 50% retracement of the $5.13 First Range Out came in at $44.38.
Chart 4
Chart 4 proves that we could reach our 3 to 1 Reward to Risk Ratio BEFORE the market reaches its 50% retracement, so there is some justification for taking the trade. Having said that, you are going to make a lot more money by focusing on the trades in the direction of the main trend. There is a strong argument for waiting until this pullback has finished, and then focusing on trading the second larger section down.
Before we move on to the next trade, let’s look at the First Higher Swing Bottom entry out of the 23 April low. You could have entered at $43.27 on 30 April, 2015, with a stop loss at $42.64 (one point below the low of your Point C on 29 April), for a risk of 63 cents per share. To achieve a 3 to 1 Reward to Risk Ratio, we would need to make $1.89. $1.89 added to $43.27 gives us $45.16.
A 3 to 1 Reward to Risk Ratio was simply not possible here. Of course, we wouldn’t know that at the time of entry – but we would know that we were trading against the main trend, and also that the market would have to exceed a 62.5% retracement, just to scrape out a 3 to 1 Reward to Risk Ratio.
Remember that no one is putting a gun to our heads, telling us that we HAVE to take a trade. If I am going to take a risk by trading against the main trend, I would like a reward substantially higher than three times my risk.
Let’s move on to the next trade, the one that I think traders should have been more focused on in this case – the 15 May, 2015 high.
(iii) 15 May, 2015 High
As discussed above, this is a far better option to consider trading than the 23 April low. We have already seen how Ranges, Time by Degrees and Angles combined to help us call this top. Now, we will see that our small picture swing chart moves could have had us trading short the day after the top. This is shown in Chart 5 below.
Chart 5
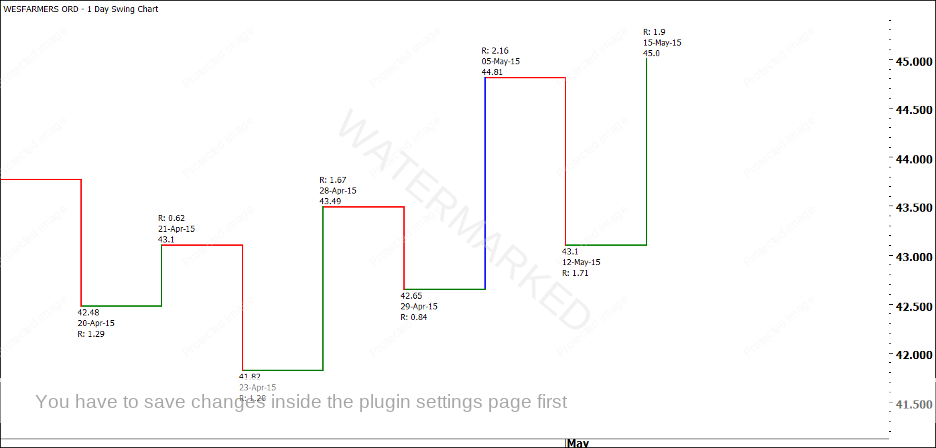
After the small First Range Out from the 23 April low, the second swing up ran 125%, then the third swing up ran just past 100% of the First Range Out. We had three sections up, as shown in Chart 6, below, so we would now be on the lookout for a change in trend.
Chart 6
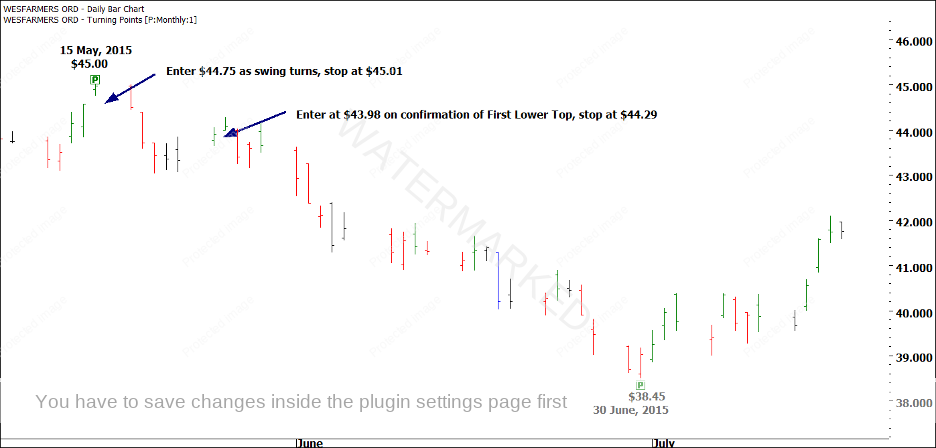
The fact that final swing up was $1.90, which was smaller than the previous swing of $2.16, gives me the confidence to trade short as the swing chart turns down, rather than waiting for a First Lower Swing Top. Both entries, however, are marked in Chart 7, below.
Chart 7
Entry as the swing chart turned down would see us risking as little as 26 cents per share, while waiting for the First Lower Swing Top gave us a risk per share of 31 cents. The challenge now is choosing our profit target.
The entire second swing down on the monthly chart ran for $6.55 ($45.00 – $38.45 = $6.55), however we probably wouldn’t know that at the time of entry. This is where it is important to remember our First Range Out, which in this case was $5.13. In a scenario like this, the First Range Out is almost always my target. I know that the second section will normally exceed the First Range Out, but I still think that is the best target to use.
$45.00 – $5.13 gives us a profit target of $39.87. Based on our entry at $44.75 as the swing chart turned down, this leaves us a potential profit of $4.88 ($44.75 – $39.87). With an initial risk of only 26 cents per share, this is a more than healthy Reward to Risk Ratio of 18.75 to 1. This is huge – a single trade like this could wipe out 18 losing trades! Sure, it took almost 7 weeks to unfold, but this is where our hard work (and our discipline to stay out of the market from the April low until the trend resumes) really pays off.
18.75 to 1 is brilliant, but that was only from a single entry. Had you added to your position on the First Lower Swing Top, you would have had a potential profit of $4.11 on a risk of 31 cents, another healthy Reward to Risk Ratio of 13.25 to 1, leaving you with a combined Reward to Risk of 30 to 1 for the campaign, on two high probability trades! And that’s without adding along the way, or taking any silly risks! If you are wrong on the setup, which looked very good, you lose 1 unit of risk. On a $10,000 account risking 5% per trade, this would be a $500 loss. In comparison, your 30 to 1 combined RRR would have netted you a handy $15,000 in profit.
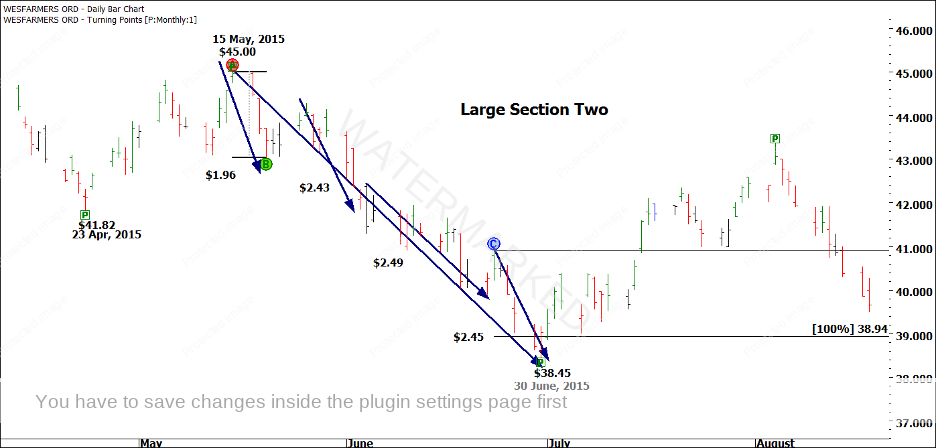
There are only two difficult parts to this trade – the first is picking the top, and the second is having the patience to hold the trade the whole way down. Before we move on to the next trading opportunity, I wanted to show you the harmony of this second section down. Using the smaller First Range Out within Large Section Two, you can see that this Range repeated in a neat four sections down, as shown in Chart 8 below.
Chart 8
Wesfarmers (which I don’t think I have ever traded or really studied) was one of the first stocks I chose to do this analysis on – I haven’t just skimmed through thousands of markets, trying to find an example that worked. Look at that amazing harmony – we know that on the big picture, the First Range Out of $5.13 worked wonders. Now, in Large Section Two, we see four small sections, with only 6 cents separating sections two to four!
Remember how the First Range Out was a little bit tricky to trade? This one was the exact opposite. It could not have been any simpler. That’s trading for you. The next setup is the 30 June, 2015 low.
(iv) 30 June, 2015 Low
So far, I hope you have been following these examples closely, recreating them in your own software, or even better, on your printed wall chart. You should also remember our discussion from above – we don’t really need to try and trade the 30 June, 2015 low because it would be a “counter-trend” trade. We could sit back and watch, and wait for it to fail, and then jump on board again when the main trend resumes. HOWEVER, in this case, I think that it was so easy to pick the 30 June low based on sections alone that I wouldn’t blame you for trading it.
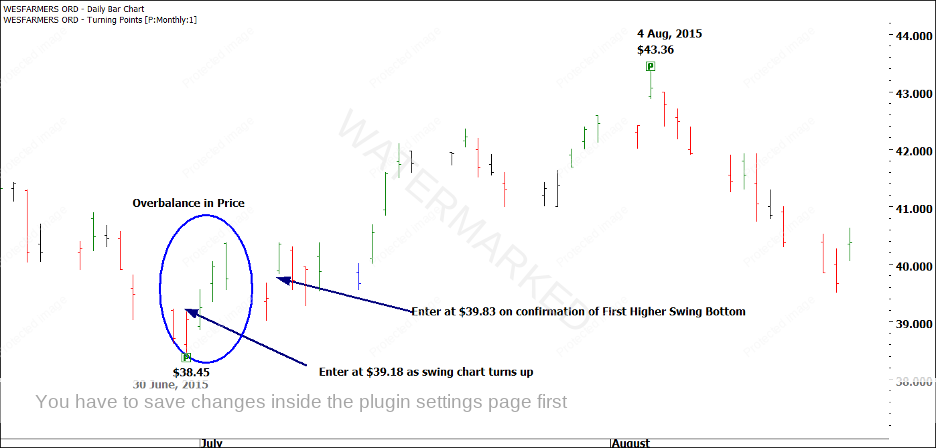
Large Section Two ended after four sections down, with the last three sections running at $2.43, $2.49, and $2.45 respectively. If you had been on top of this, you should have had little difficulty entering as the swing chart turned up on 1 July, 2015. Alternatively, you could have watched the market give you an Overbalance in Price and then fail the Retest, as shown in Chart 9.
Chart 9
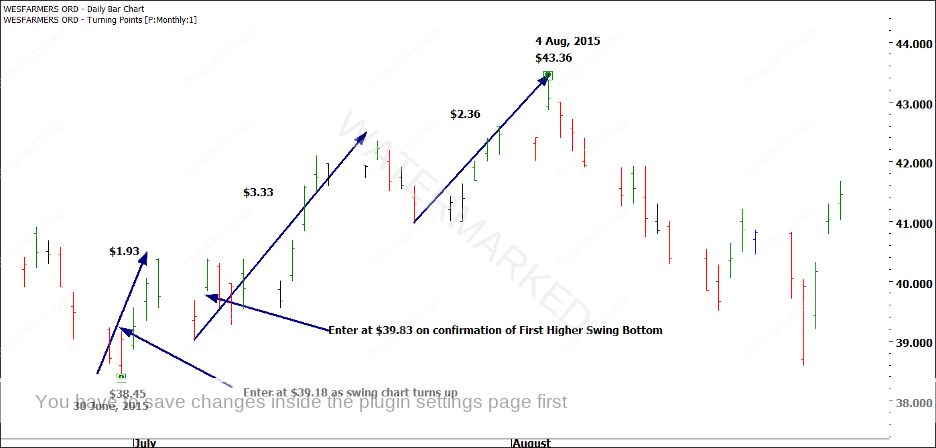
Hopefully by now, you can recognize the different stages of this setup – the completion of four sections into the low, the Overbalance in Price ($1.93 compared to $0.99) to the upside, and the failure of the Retest at the 50% milestone on the way down ($1.36 compared to $2.45).
We know that the run up from 30 June to 4 August was $4.91 ($43.36 – $38.45), which is just over 150% of the previous run up into the 15 May top, but again, we didn’t know that at the time of the trade. Setting a profit target for these kinds of trades can be difficult. Sometimes, it is a case of just watching the sections unfold, as shown in Chart 10 below. We can see three sections, with the third section ending on 4 August, 2015.
Chart 10
(v) 4 August, 2015 High
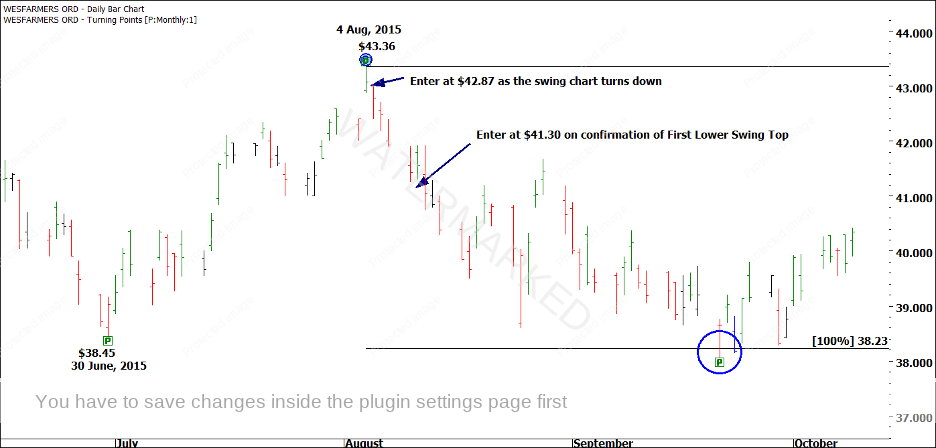
By this stage, we have seen two large sections down, and two pullbacks. We are about to enter the Third Large Section, which MIGHT be the last one (obviously we know it wasn’t). Again, we set our target price at $43.36 – $5.13 = $38.23, and we look to enter at either the first down day after the top or the First Lower Swing Top. This is shown in Chart 11.
Chart 11
This is a great example of why I often like to enter a trade, then not touch it until it is either stopped out, or reaches the 100% milestone. Have a look at the middle of the run – swing tops are broken, and the market gets a little bit choppy. Had you moved your stop loss down, you would probably have been stopped out at some point.
An entry at $42.87 as the swing chart turned down would have had a risk of 50 cents per share, with a potential Reward of $4.64, giving a Reward to Risk Ratio of 9.28 to 1. An entry at $41.30 on confirmation of the First Lower Swing Top would have had a risk of 63 cents per share, with a potential Reward of $3.07 or 4.87 to 1. While both of these are more than acceptable Rewards, you will note that they are far less than the 18 to 1 Reward to Risk Ratio we saw earlier. If you go back and look at that trade again, you will note that the actual day of the top was a very small price bar. The smaller the price bar, the smaller the risk per share. The smaller the risk per share, the larger the Reward to Risk Ratio.
Once you are in a trade like this, it doesn’t take very much work to monitor – you can do it in a minute or so per day. Ask yourself – once you have a market like this setup, how many of them could you comfortably monitor before it became too much?
The next setup is the September low.
(vi) 21 September, 2015 Low
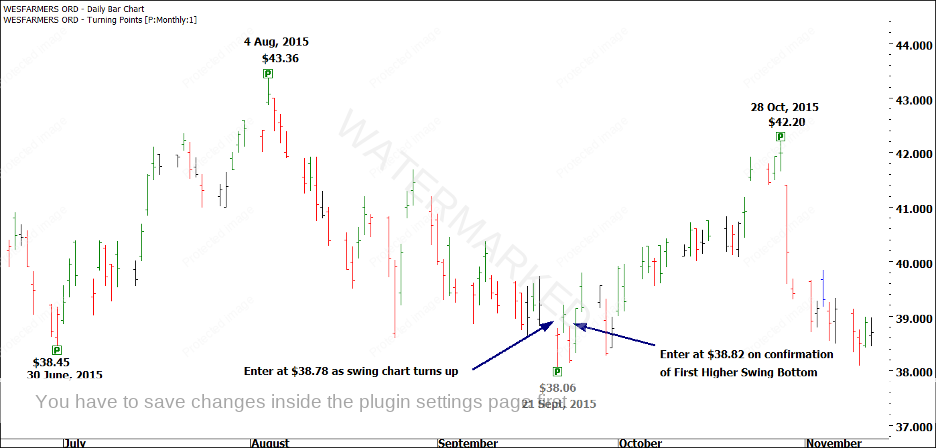
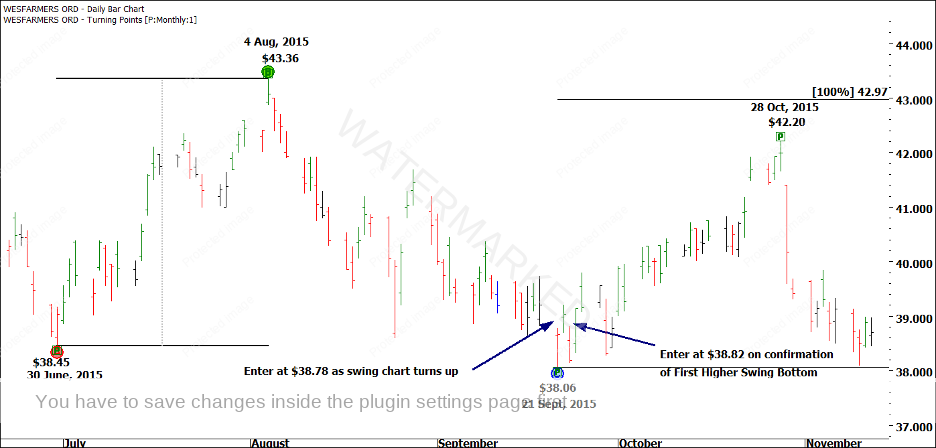
Up until this point, I have strongly favoured trading in the direction of the main trend only. However, now that we have seen three large sections down, we know that Gann tells us to watch for a definite indication of a change in trend. In Chart 12, I highlight the usual potential entry points.
Chart 12
Whether you entered as the swing chart turned up or on confirmation of the First Higher Swing Bottom, your entry price was almost identical at either $38.78 or $38.82, with a risk per share of either 73 cents or 68 cents per share.
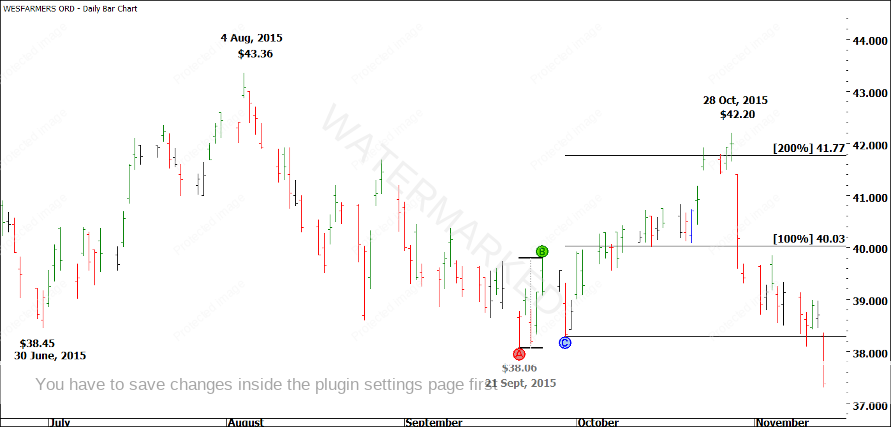
Chart 13
In Chart 13, you can see that WES failed to even reach 100% of its previous pullback – certainly not an indication of a change in trend. We now know that a fourth section down commenced after the October, 2015 high, although the gap down would have made it difficult to enter. Before we look at this fourth section, I want to quickly cover the sections from 21 September to 28 October, in Chart 14 below.
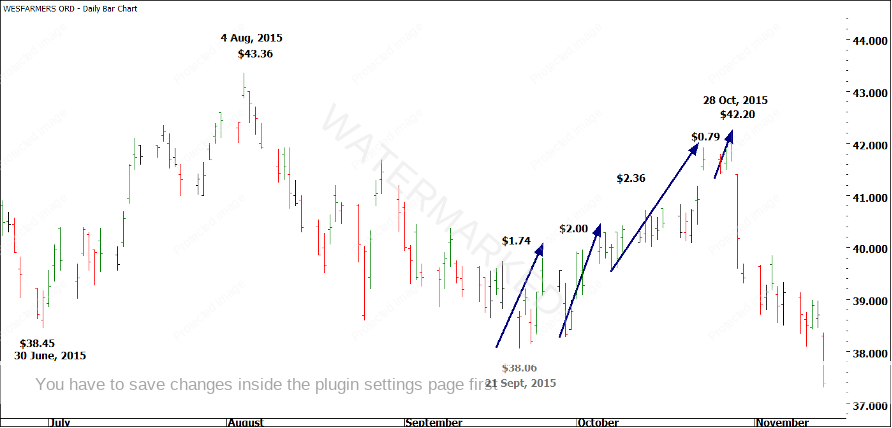
Chart 14
The initial swing range out of the September low was only $1.14, a small clue that we hadn’t seen the end of the down move. It is not an Overbalance in Price, and quite small compared with the Ranges in the entire down move. Because of this, I have used the slightly bigger Range of $1.74. As you can see in Chart 14, above, WES ran a little over 200% of this Range into the October, 2015 high. Using the $1.74 Range, we can break the September to October move down into four sections, with the final section failing at the 50% milestone. This is shown in Chart 15 below.
Chart 15
With four sections up in price, and only 75% of the 30 June to 4 August Range completed, it was safe to say that WES had NOT made a final bottom, and that a fourth section down was due.
(vii) 28 October, 2015 High
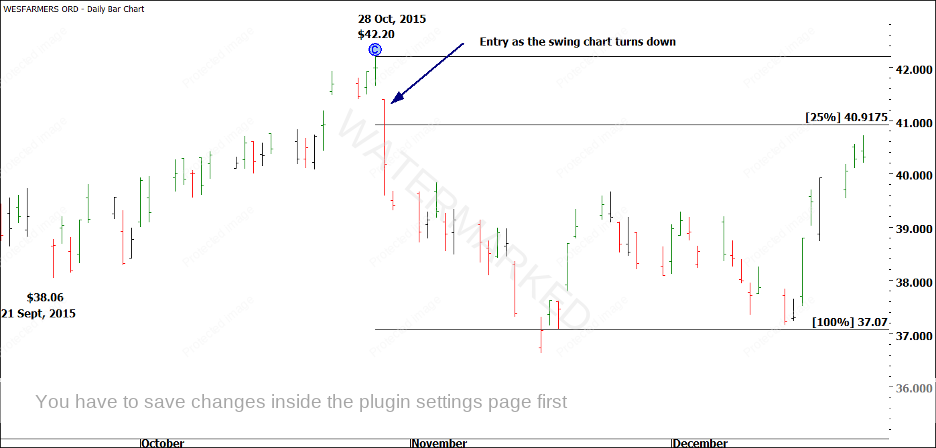
Trading this top successfully required you to be on your toes – you needed to recognize the market’s weakness on 28 October, and you needed to be able to enter quickly as the swing chart turned down on 29 October, BEFORE the market ran too far away from you.
It is impossible (now) to calculate your Reward to Risk on this trade. We know that the profit target would be $37.07, as shown in Chart 16 below, based on the $5.13 First Range Out we have been using. However, we have no idea at which price we could have entered. Did we enter at the open? Did we wait to see if the gap was filled first, only to see the market run further away? Did we miss the top altogether, decide to wait for a First Lower Top, and then see the market run off without us? Unless you personally took this trade, you don’t really know what would have happened.
Chart 16
Look back over the trades and sections so far. It’s funny how easy some of them seem, and then funny how hard some of them seem. In my experiences as a teacher, I see SO MANY people try to trade a difficult section, miss out, then leave the market alone, missing out on the easy trades. Trading is not easy – all of the time. Trading is not hard – all of the time. Trading is a mixture of easy periods and hard periods (and some “medium periods” thrown in for good measure!) If you miss a trade, all you can do is go back to the drawing board, look for the next setup, and patiently wait for it.
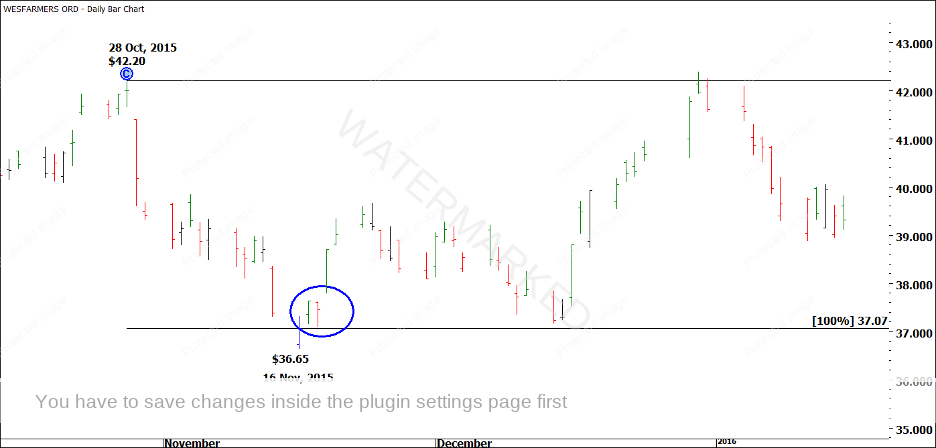
(viii) 16 November, 2015 Low
And now we come to the final trade of this Exercise. I hope that you have enjoyed working your way through these. Actually, I’d be happy if you’ve just worked your way through them – you’re doing this to learn, not to have fun.
The 16 November, 2015 low was an easy one to call and a fairly easy one to enter – holding on to your position (especially if you tried to add more) in the face of steep pullbacks was the hard part. Let’s take a look at the setup in Chart 17 below.
Chart 17
To be honest, it really was a simple decision to make. When you have seen four sections down, and the final section has hit 100% of the First Range Out, and is 180 degrees from a major turn, and has hit a 4×1 Trading Day Angle, you are well within your rights to attempt an entry. You could have entered at $37.32 as the swing chart turned up, or at $37.92, the opening price on 19 November, when WES gapped up to confirm a higher swing bottom.
Notice that after breaching 100% on 16 November, WES rallied only a small amount, then came back and Retested the 100% milestone. This is another “small” First Range Out that would have you concerned about whether or not the low was in. However, the fact that we had now seen four sections down would have given you confidence that the turn was now in.
The Range up to 24 November, 2015 was $3.01, and I think this is a suitable Range to use going forward for your smaller picture projections. We have already covered this work in “Ranges”, way back at the start of these Exercises, noting the smaller weekly Ranges and the larger, monthly Range that they constructed.
This brings us to the end of Exercise 10. I’m really pleased at how this Wesfarmers move unfolded – I could have shown you some currency exercises that were “easy” all the way through, but that wouldn’t have been realistic. Sometimes, the market is easy, sometimes it is hard, and I think this period on Wesfarmers was a good example of a typical nine months or so of trading.
If you made it this far, congratulations, you have done extremely well! Your reward for your persistence is Exercise 11 – The Test!
