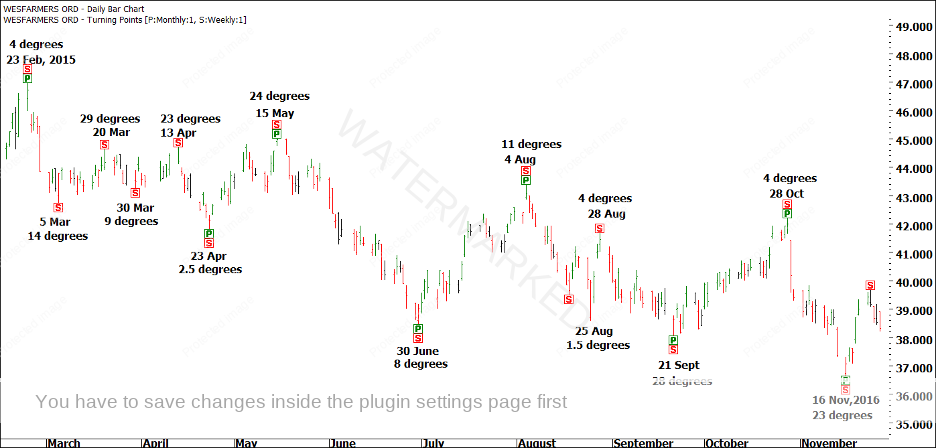
Below, I have copied a chart from ProfitSource containing the degree counts at the turns. I have generally rounded to the nearest degree, except when it was right on “half a degree”. I’m sure you noticed a common theme while undertaking this work! I will then go through the dates of the start and end of each section on the monthly chart, to see how Time by Degrees could have aided us in calling these turns.
Keep in mind that where I saw “4 degrees” or “11 degrees”, this is the reading from the ephemeris. It is NOT the number of degrees between turns.

The top of 23 February, 2015 (a major top, and the start of Section 1) came at a reading of “4 degrees” from our Swiss Ephemeris for 2015.
End of Section 1 – 23 April was 58.5 degrees from the 23 February top, and a good place to watch for a change in trend. As previously noted, Section 1 was probably the toughest section to trade during this run. However, once you saw the low forming on 23 April, just short of 60 degrees from the top, and coming at the 200% milestone of the 20 March and 13 April Double Tops, you should have been on guard for a change in trend.
Start of Section 2 – the 15 May top was a 62.5% retracement of the Section 1 Range. It was also 30 degrees from the previous weekly swing top on 13 April.
End of Section 2 – the 30 June low was 124 degrees from the high, a few days later than we may have expected. If you were trading Time by Degrees ALONE, you may have been a bit confused, however if you factor in the Ranges, you would have been an excellent chance of successfully trading this move. Note that the market only crossed the 100% price milestone from the First Range Out on 26 June, a Friday. From here, you would have been on guard for a change in trend. It came only 2 trading days later, on 30 June, with a nice little Signal Bar.
Start of Section 3 – the 4 August top was 34 degrees from the end of Section 2, and just short of the August Seasonal Date. Note again the Signal Bar on 4 August. Can you see how the pullback after Section 2 was made up of three small sections in price? I love Ranges
End of Section 3 – the 21 September low came in almost perfectly on the 100% price milestone of the First Range Out (Section 1), just before the September Seasonal Date.
Start of Section 4 – the 28 October top that began the final section down came in at 4 degrees, the same degree count as the 23 February top that started the whole move and 60 degrees from the 28 August weekly high. The end of Section 1 came in at 2.5 degrees, so again it is the right time of the month.
End of Section 4 – the move ended on 16 November, 2015, again right on the 100% milestone of the First Range Out, and this time 180 degrees from the May top.
In conclusion, I would argue that there is enough Time by Degrees evidence to show that the technique is important, but also enough to prove that it is not something you would use as a stand-alone tool. Having said that, can you see the power of combining Time by Degrees with our Ranges?