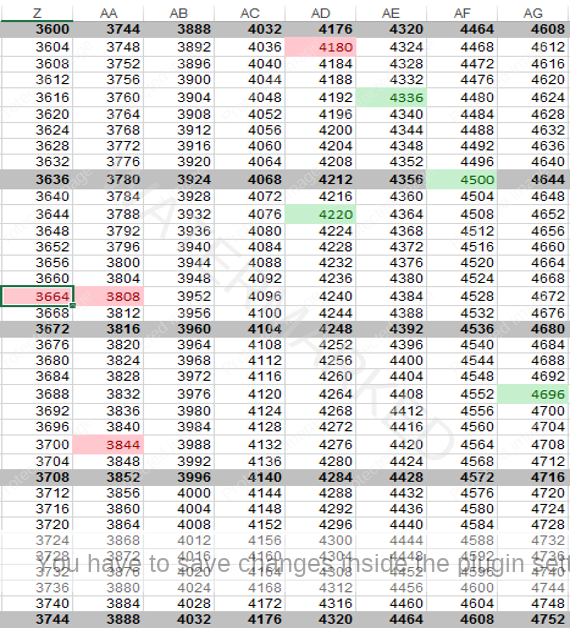
First, we will look at the spreadsheet. During the webinar, we saw a long line of lows all lining up around the same vibration level on the Square of 144. Here, the picture is less clear, as shown below.
The key points to note are that the low of Section 4 was 141 points ($1.41) below the low of Section 3 (Approximately 1 Square of 144), while the low of Section 3 was 39 points ($0.39) below the low of Section 2 (1/4 of a Square of 144). The low of the First Range Out ($41.82) is close to lining up on the Square of 144 with the high of Section 3 ($43.36), but it is not perfect.
Although there is some harmony here, it would be very difficult to trade using this tool in isolation. However, it might provide some useful confirmation to our Ranges, Time by Degrees and Angles work.
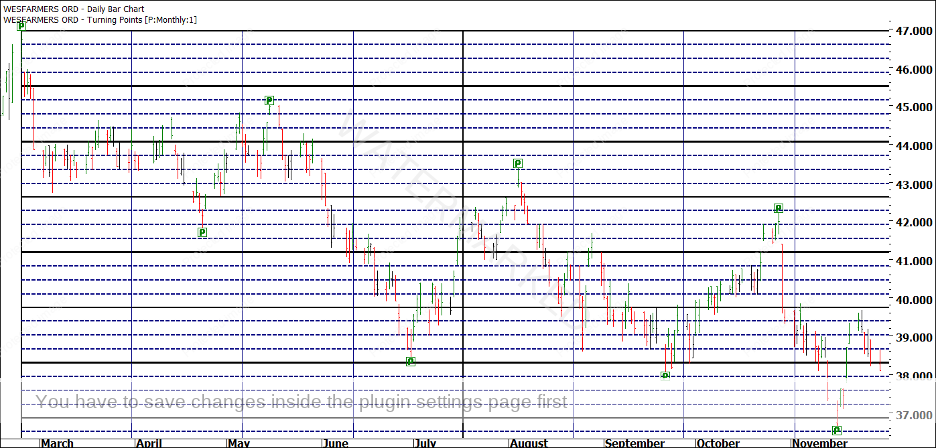
Part 2 of this exercise asked you to essentially do this work again using the software. The results are shown below, and may be a little bit clearer.
You can see that the First Range Out ended just past 3.5 Squares of 144, while the second section ended just short of 6 Squares of 144. The pullback after the second section ended at 2.5 Squares of 144 from the top.
Also notice that the low of the third section and the low of the fourth section are very close to 1 Square of 144 points apart.
If you wanted to use the Square of 144 on this market with confidence, you would need to do a lot more work. Don’t worry, we will do more – in Exercise 9! However, this is a great place to start on any market – print out the spreadsheet and start circling the prices of tops and bottoms.

