- Print out an A4 section of the Square of 144 spreadsheet (from your handouts), covering the price range of $30 to $50 (3000 to 5000). Circle the prices of the highs and lows at the start and end of sections (the monthly swing tops and swing bottoms that we have been working on, from 23 February, 2015 to 16 November, 2015). Look for any correlation on the Square of 144.
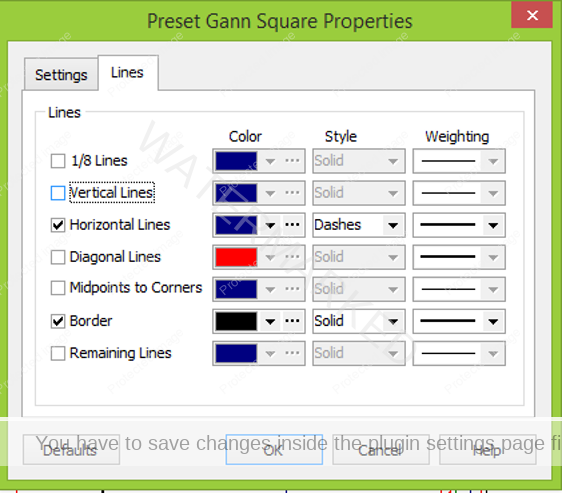
- Use the “Preset Gann Square” tool in ProfitSource (or the relevant tool in other trading software) to run a Square of 144 down from the 23 February, 2015 high. Use Calendar Days, a Point Size of 0.01, and only have Horizontal Lines and Border ticked, as shown below.

The sole aim of this exercise is for you to make a decision – is the Square of 144 (in this form) a technique that would help you make better trading decisions on this market?
Without trying to influence your decision one way or another, I will let you know that there are plenty of times you will have to say “No” when it comes to a particular application of a technique such as the Square of 144. If you try to use the Square of 144 in every possible way, running every different point size from every conceivable starting point, you will end up with dozens of conflicting viewpoints of the market, and will end up being frozen in your analysis.
The burden of proof is on the Square of 144 – no one is putting a gun to your head and saying “you MUST watch all of these!” Instead, it should look so good that you say, “Wow! OF COURSE I’ll use this!”