You may not have realised it, but these most important pressure points can be placed around the Gann Emblem, which is displayed on the cover of Gann’s courses, and indeed is our company logo:
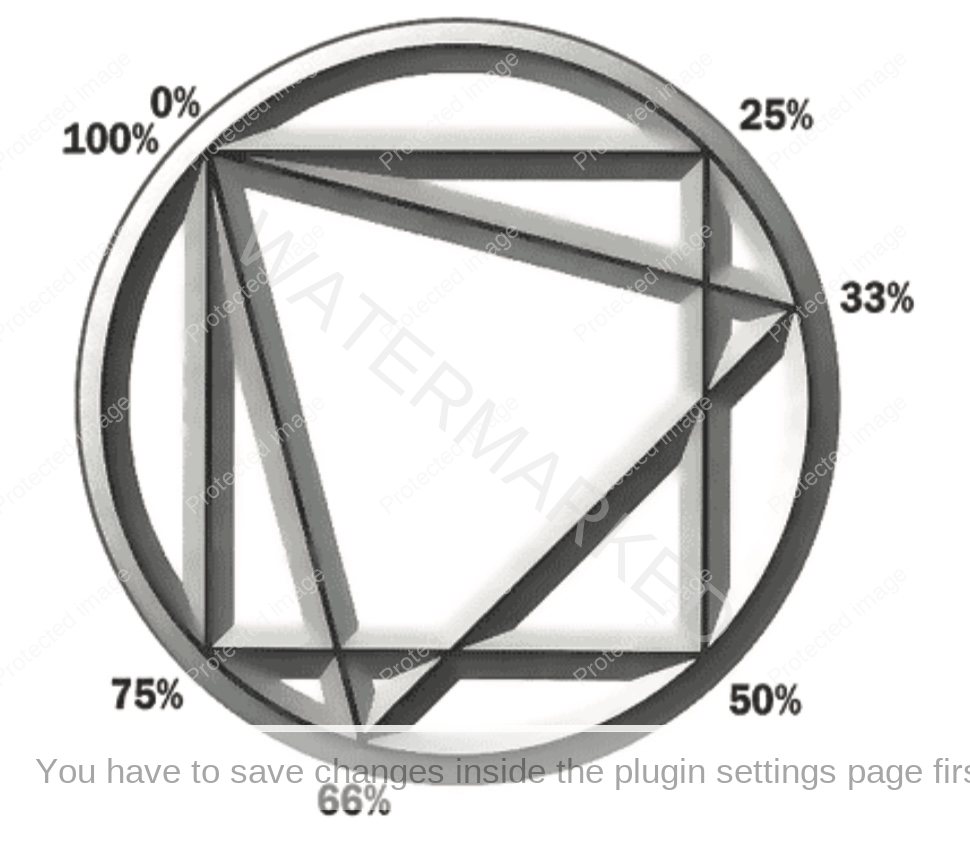
Many of Gann’s discoveries can be directly related to this emblem and these important pressure points! Can you see a relationship between the Gann Emblem and our Seasons of a Trade diagram?
Later in this Course is the glossary of terms, in it, I make mention of the Fibonacci ratios. You will see I mention the ratio 1:1. This is often too simple for technical analysts, but it has the highest percentage of repetition, so we use it as the basis of our calculations. It is our yardstick for price targets.
Gann, throughout his career, used eighths, quarters, halves and thirds as the basis of his calculations for resistance points. Remember 1/3 + (1/2 of 1/3) = 1/2 or 50%, so this is how I arrive at my pressure points. You will note that the prime Fibonacci number of 0.618 is very close to Gann’s 5/8 or 0.625. If we subtract 0.618 from 1, we get 0.382 which, once again, is very close to Gann’s 3/8 or 0.375. What you should accept is that at these percentages of either a price or a range, significant buying and selling orders will hit the market causing at least temporary resistance, or on some occasions, a change in trend.
Another yardstick for your analysis is that if a trade only advances 0.625 or 5/8 of the previous A-B range, we are talking about a contracting market. If a market covers very close to 100% of the previous A-B range it is neutral, but if it completes, says, 1.625 of the previous A-B range, it is an expanding market. Most markets start to contract before they change trend.
To summarise
0.625 of previous A-B range
= contracting (high risk) market
= unsafe trade
1.000 of previous A-B range
= neutral
= average trade
1.625 of previous A-B range
= expanding (low risk) market
= safe trade