Tradeable Ranges
Welcome to the midpoint of 2024 where we close off the end of the financial year in Australia and the halfway point of the calendar year. In Australia we enter the cooler months and shorter days and if you’re like me, you find that energy can wane a little bit to do all the things you have to and of course want to do. The end of financial year forces us to look at our trading business through a commercial lens and tally up the results. David used to say the money was simply the way you keep score, but it can be a heavy load to carry if you are not in the black. Last month I spoke a little about avoidance in trading and how as an emotion it’s not one that gets us closer to success.
You should sit down in a calm manner and review your trading year and acknowledge what has worked and what has not, and then set about enacting a plan to address any areas you want to improve.
If we look at the trading style of traders using Gann and David’s work as their basis, we are trend followers predominantly (this can mean being aggressive at identifying changes in trend) and then looking for ranges that deliver enough movement to make them worthwhile. What I suggest is a tradeable range may differ to you, but in Crude I look for more than $10USD.
We can of course adjust our perspective to deliver different ranges to trade, we can trade off smaller or larger time frames, and this will change the reference ranges. We can also look to enter on a smaller time frame and then zoom out to manage on a larger time frame. This is very much the way I would suggest many here are trading or looking at a destination.
We left off last month with the oil market heading lower off resistance, we see that the price action has now rallied.
Chart 1 shows the run down from early April, note that we are seeing several early in the month dates as turning points. The ranges are both healthy in terms of making them tradeable, with the current run down $15.15. David would say if he could get half of a decent range, he was happy.
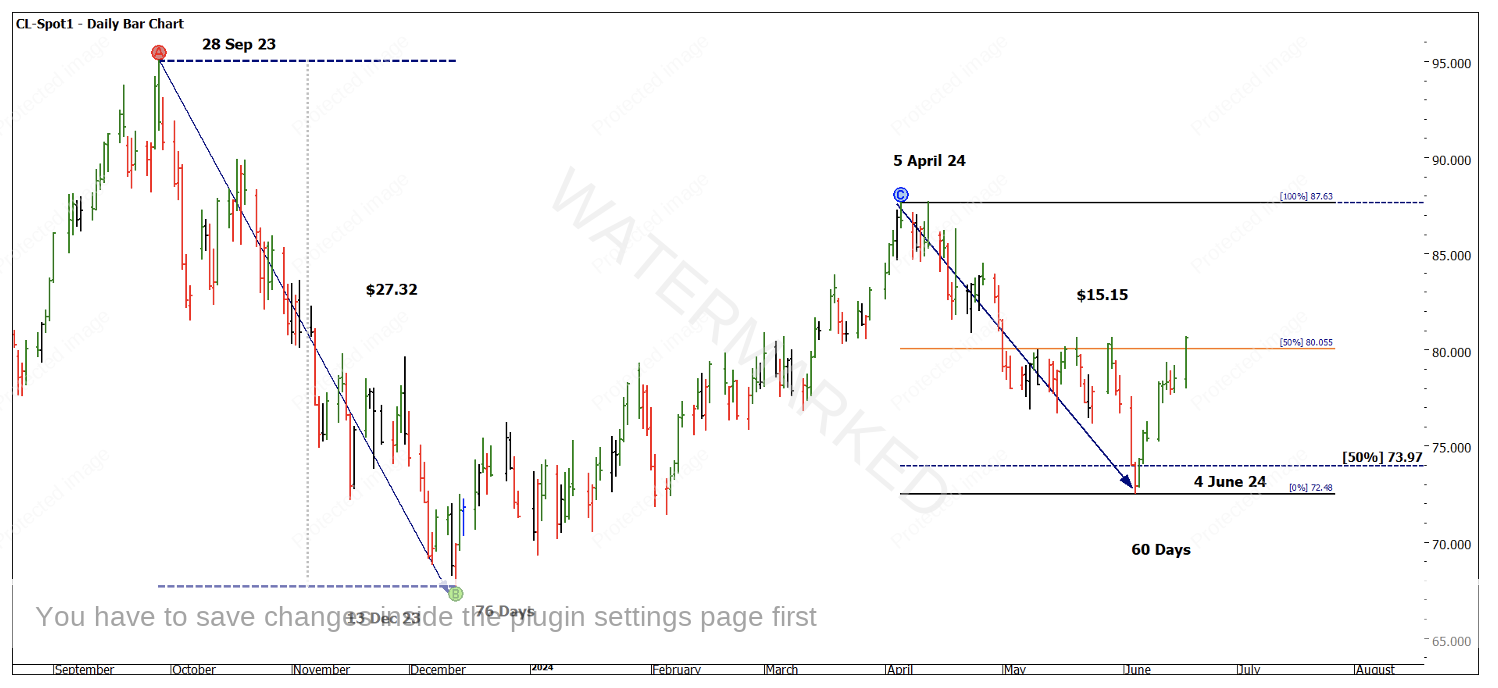
Chart 1 – Daily Bar Chart CL-Spot1
The move down found support at $72.48 which is just past the 50% milestone of the previous range ($73.97) and the reversal has seen the price action push back to approximately the $80 level where there are several tops. This would be a key area to watch for whatever comes next.
Chart 2 shifts our focus onto the swing chart and ranges. The double top (albeit on a smaller scale) helps confirm resistance but does not give us a range to follow in terms of a bigger picture 200%.
Using an end of day entry on the confirmation of a lower swing top we can enter with approximately $2440 USD risk per contract. The challenge with the larger ranges on Oil is that end of day risk can be large in a dollar sense. Keep in mind our risk rules can mitigate this to the same percentage of our account (we can use CFD’s to further reduce position sizes to accommodate our account size.)
The swing ranges were orderly in terms of repetition until early June where the overbalance in price of $6.84 was seen. Given the 50% pressure point from Chart 1 as well as some basic Time by Degrees, you should have certainly tightened stops on the short side into what is currently the June low. Given the range was approximately $15 USD for a risk of $2.44 there were ways to ensure we achieved a 3 to 1 Reward to Risk if we captured half of $7.50 of that move.
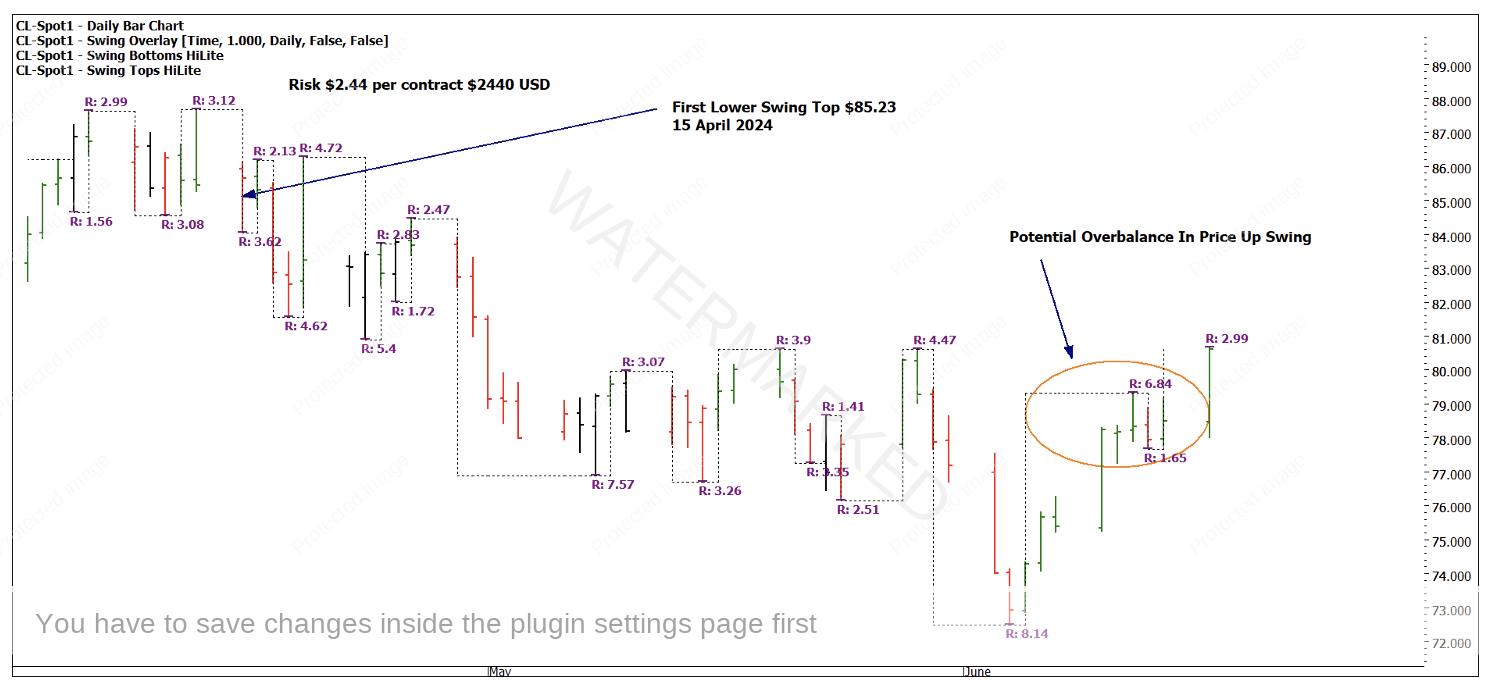
Chart 2 – Daily Bar Chart CL-Spot1
One of the great challenges when we specialise in markets is that all tradeable ranges won’t necessarily be a 10 to 1 Reward to Risk Ratio (intraday position setting can help in this regard). If you are comfortable to accept that you can capture the big ranges when they come and the smaller ranges as a “top up” as they develop, then a single market that trends and follows your rules can offer all you need from your trading business.
As mentioned, the $80 level will be one to watch in the coming period and we can look to see how the market engages with it. Chart 3 shows the last 16 years of price action, and we can see that $80 level has acted as a loose midpoint. The price action struggles to hold above for a consistent period.
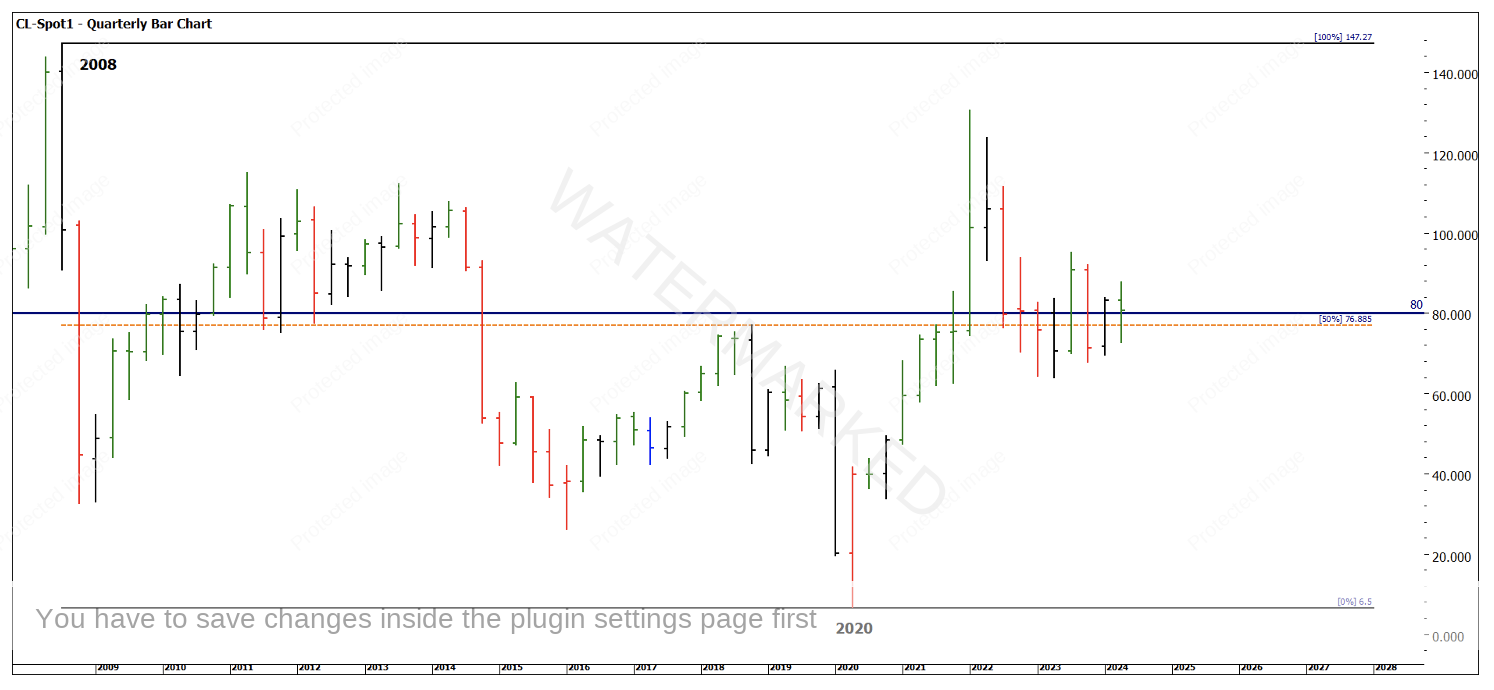
Chart 3 – Quarterly Bar Chart CL-Spot1
The macro environment for inflation, energy and commodities as a whole against the backdrop of slowing economic growth globally places this market at the forefront of my mind and as long as it continues to provide tradeable ranges then it will maintain my interest.
Good Trading
Aaron Lynch