Traders Delight
As with all cycles there is a time to feel the joys of good times and the flipside when things seem to go against you. The time of the trader is certainly now, and it comes back to a recent comment that Mat made when reviewing David’s comments about not having to be in the market all the time. There are so many good trades why take the bad ones?
A follow on from last month sees the SPI200 still failing to conquer the 8,000-point level with the US markets pushing through their recent resistance and the stock from last month we discussed, Morgan Stanley, falling away as it reached $103 a share. Many markets are moving, and this is a key requirement for our style of trading, let’s avoid the ones that are sideways and problematic. This again is a strength we can harness in terms of not trading those markets.
The key driver for this month’s article is based on a recent experience as I found myself at a gathering of many institutional investors, predominately long only funds and how they see the market is very different to the single nimble trader. The long only funds are forced to participate in positions going south and they continue to hold, they of course have far longer time horizons, but they operate on a great deal of bias that the decision they made to get long will pay off given enough time. They also mentioned issues around EOFY and tax treatment of their positions. They are influenced by the tax implications of a position and timing of that tax so this can drive them to hold positions longer than we might otherwise, as tax benefits can flow their way. As I said very different to our mindset. I still remember a key interaction I had with an attendee of a Trading with Safety seminar many years ago who said they couldn’t afford to trade as they couldn’t pay the tax bill. That one will never leave me.
I managed to get into a deeper conversation with a long only fund manager who specialises in the mining sector and the ASX specifically. The topic of Rio Tinto came up and I was caught in two minds as to whether I should show this person a working chart of this stock that I run.
Over the years I have developed a nice gap trading system on this stock, built around basic price and time work and it certainly delivers when this stock trends.
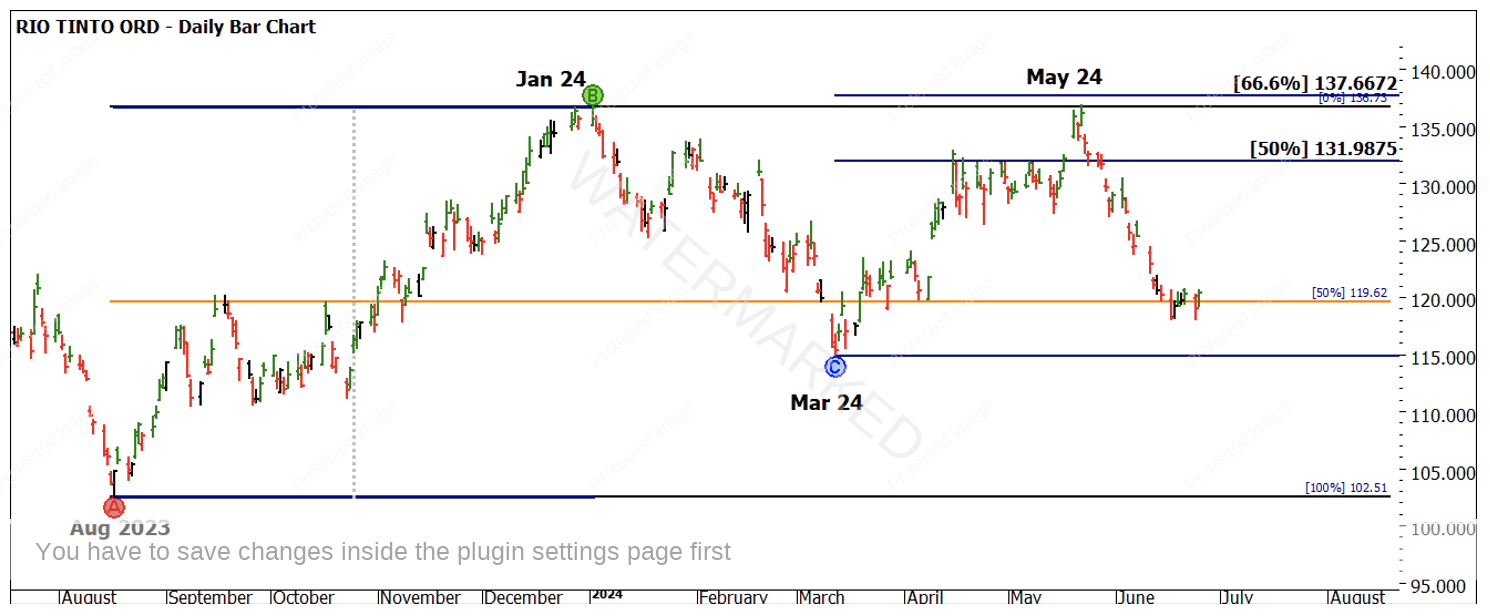
Chart 1 sets up some important areas, the clear double top pattern is hard to miss. If I could only trade one pattern I would be hard pressed to go past double tops and bottoms, add some basic price pressure and you have a method.
Chart 1- RIO.ASX Daily Bar Chart
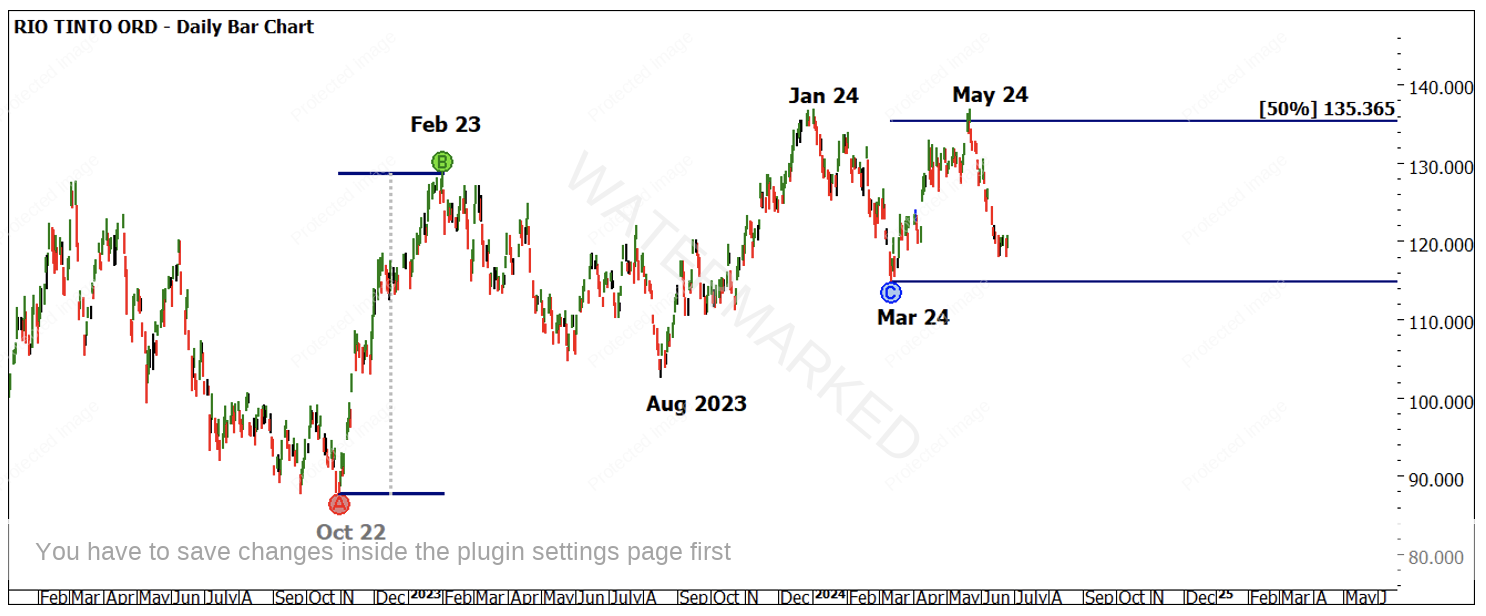
Sadly, we did not see the previous range of 2023-2024 repeat with any major milestone into the May 24 high. Chart 2 suggests that we keep one eye on all relevant ranges to see if they have a part to play. The October 22 to February 23 range delivered a nice 50% milestone as the market found resistance at the previous January 24 top (giving us our double top).
Chart 2- RIO.ASX Daily Bar Chart
Seeing the double top pattern confirmed (even in hindsight) allows us to consider would we stay long or potentially short? However, if you are a long only fund these moments can provide heartburn. A 12% drop in a month or so is a ride most fund managers would like to avoid.
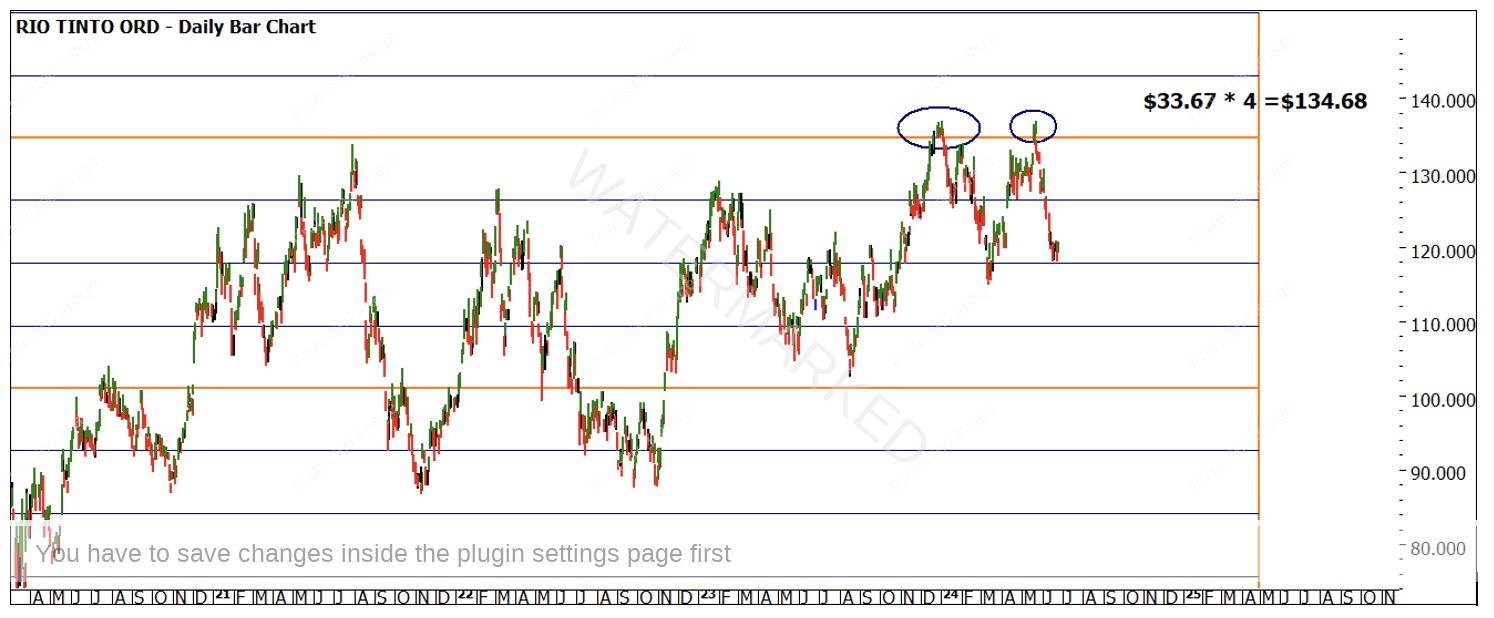
Chart 3 helps us firm up that these double tops may have a higher probability than any old double top. Using a Lows Resistance Card (the 2016 low of $33.67) and projecting multiples higher, we see that’s 4 times the low is $134.68. The second top came in at $136.82, the two tops were 5 cents apart from January to May.
Chart 3- RIO.ASX Daily Bar Chart
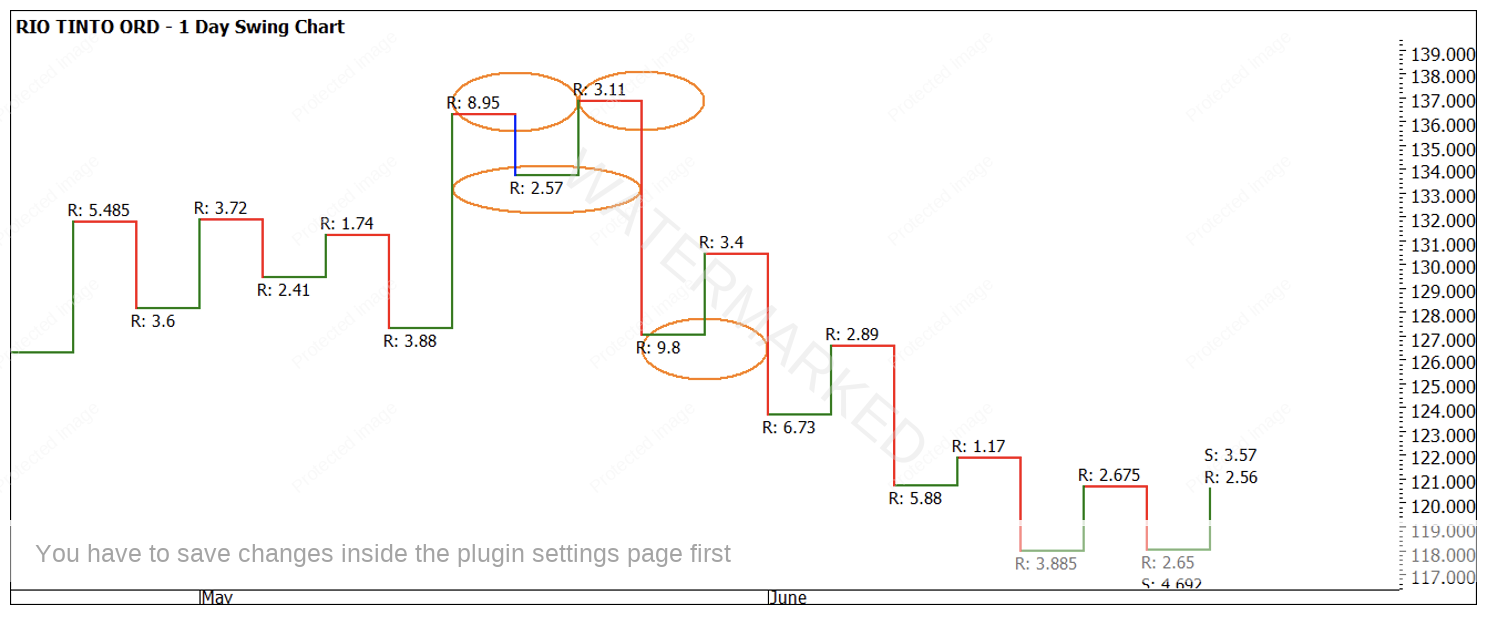
At this stage if you haven’t done any work in this field a pattern and a few pressure points may not seem an overwhelming study. There was a good confirmation signal from our swing chart if you look at the contraction of ranges into the high and expansion on the way down (See Chart 4)
Chart 4- RIO.ASX Daily Bar Chart
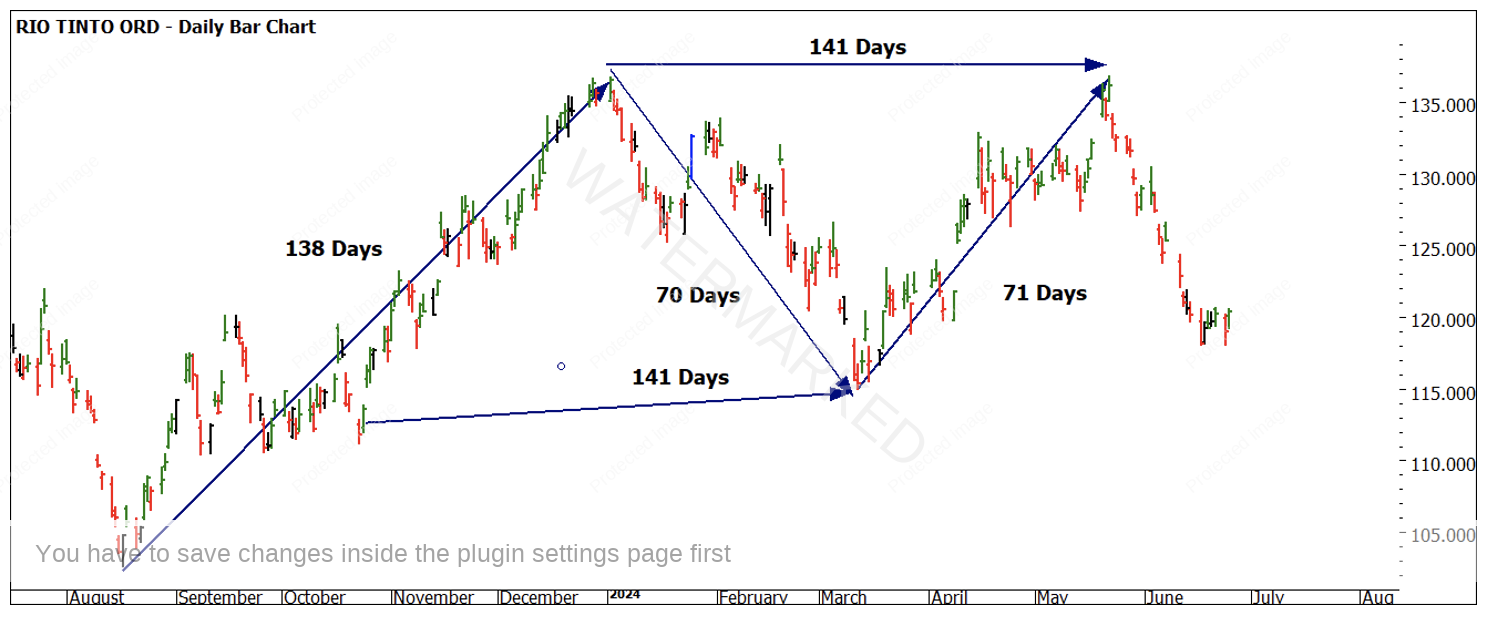
It was around this time that I considered whether to share the next chart with my new friend. There is much that can be achieved with the work of price, when layered with the 2nd dimension of time-based analysis, it can sharpen up your trading plan and provide confidence and conformation to your setups.
I will leave you with this last chart as I did with them and I appreciate that you may not yet be studying time-based analysis, keep it simple and remember we look for history to repeat in all that we do. We look for patterns and repetition where others see random walk and therefore no value in technical analysis.
Chart 5- RIO.ASX Daily Bar Chart
Good Trading
Aaron Lynch
