Trading a Runaway Market
The year is already shaping up with a variety of themes that cross from financial markets to the main street mindset. If I asked many in the public their thoughts on the lumber markets and the current pricing, most would offer next to nothing in terms of content or opinion to the discussion. Interestingly I typed “lumber futures” into the Bing search engine and an AI chat bot took over and asked me to enter information that I was interested in, and it began to spew out interesting facts and figures around lumber futures. This brilliantly confirmed my point that we are seeing an AI revolution and the current hottest tech stock on the planet is Nvidia (NVDA) on the NASDAQ. As a company they are building the chips that power AI learning, which has seen the share price move exponentially to the upside..
My first memory of Nvidia was buying a computer pre 2000 that had a graphics card created by Nvidia. From a trading perspective it came up from time to time when delivering seminars in the US as it was then (and even more so now) a popular stock to trade. We are seeing this current darling rocket higher, which arguably offers some more tangible benefits to society than say GameStop that sparked the “meme stock craze” of recent years. Many are asking can it keep going higher or will it crash, my take is who cares as long as it moves, and we can deliver meaningful analysis and a meaningful trading plan to capture it.
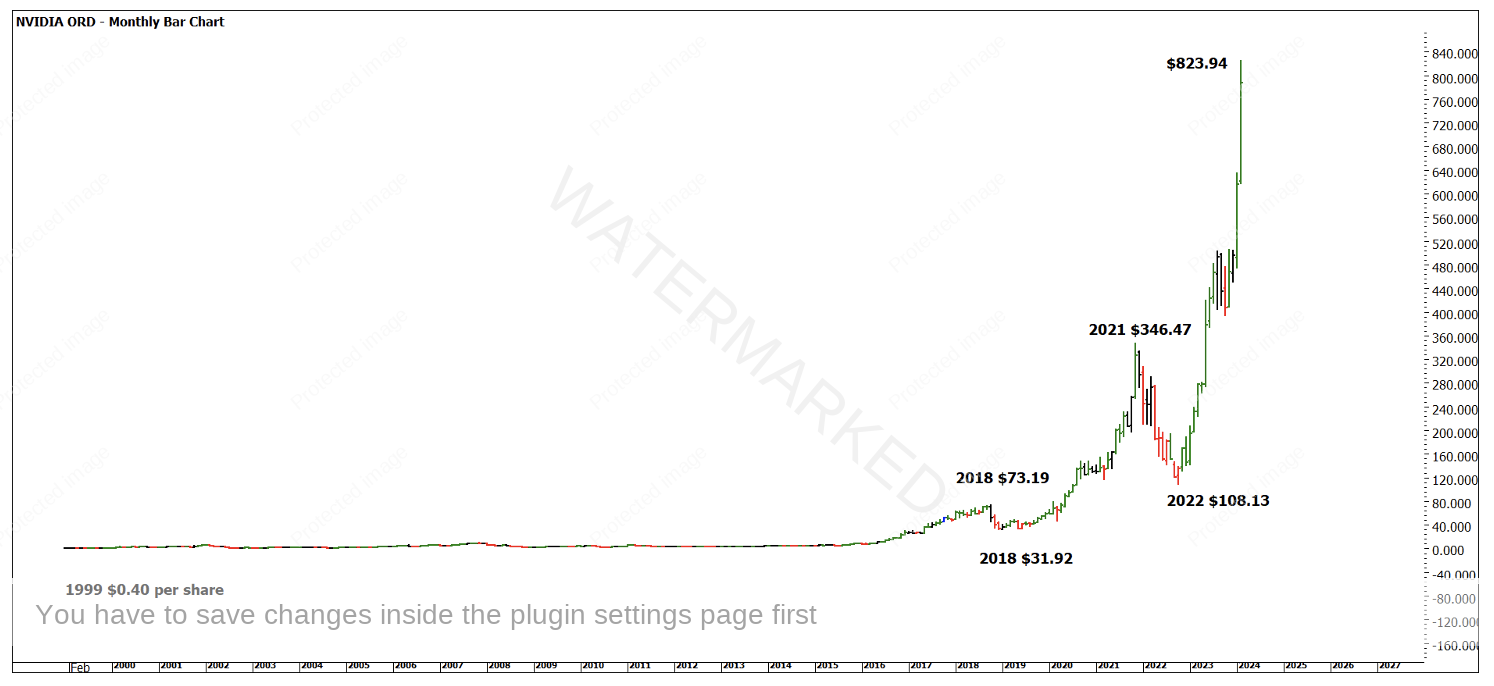
Chart 1 jumps to a wide timeline and reviews the history and its recent rise. As you can see a $0.40 per share investment in 1999 would have yielded a very handsome return years later. People often ask whether you can forecast a move of this magnitude, the answer is yes and no. More simply I have always found the market will offer areas that cycles can commence from. David used his method of Rating the Market to understand when moves could occur, but it was also helpful in understanding the magnitude of a move. That being said, I would be happy if I anticipated a move of 100% and only got 50%. The same goes for the opposite “miss” if I expect a 100% move and it moves 1,000% is that really a bad thing?
Chart 1- NVDA Monthly Bar Chart
We don’t have to forecast or expect a move of 700% in a year to make money. Sure it’s nice and memorable, but not one that is likely to repeat in one market. Is it a bubble or sustainable? What do the charts say?
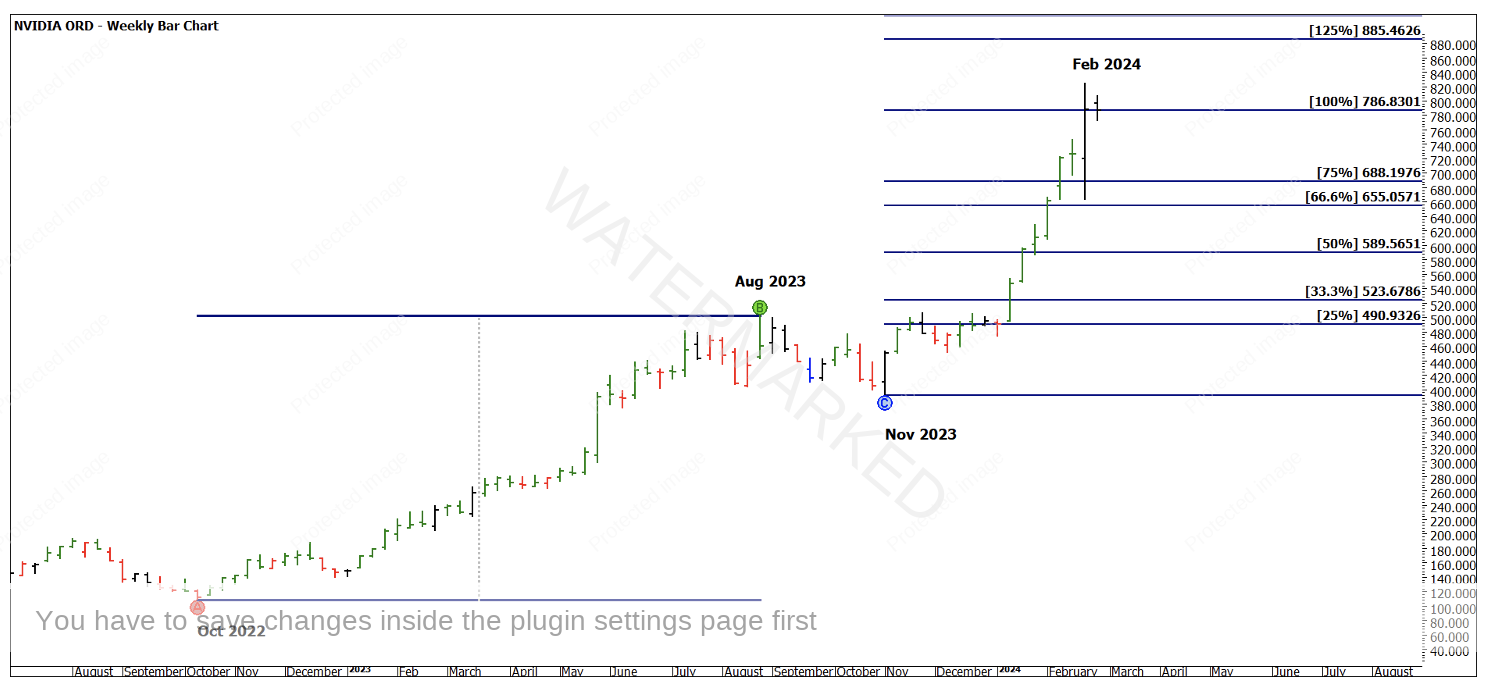
Chart 2 shows the most recent ranges that we can measure and focus on. The current range up has hit 100% of the previous range, however, it has taken approximately 1/3 of the time when compared to the October to August move. The small retracement from August to November was one significant sign that a larger move to the upside was possible.
Chart 2- NVDA Weekly Bar Chart
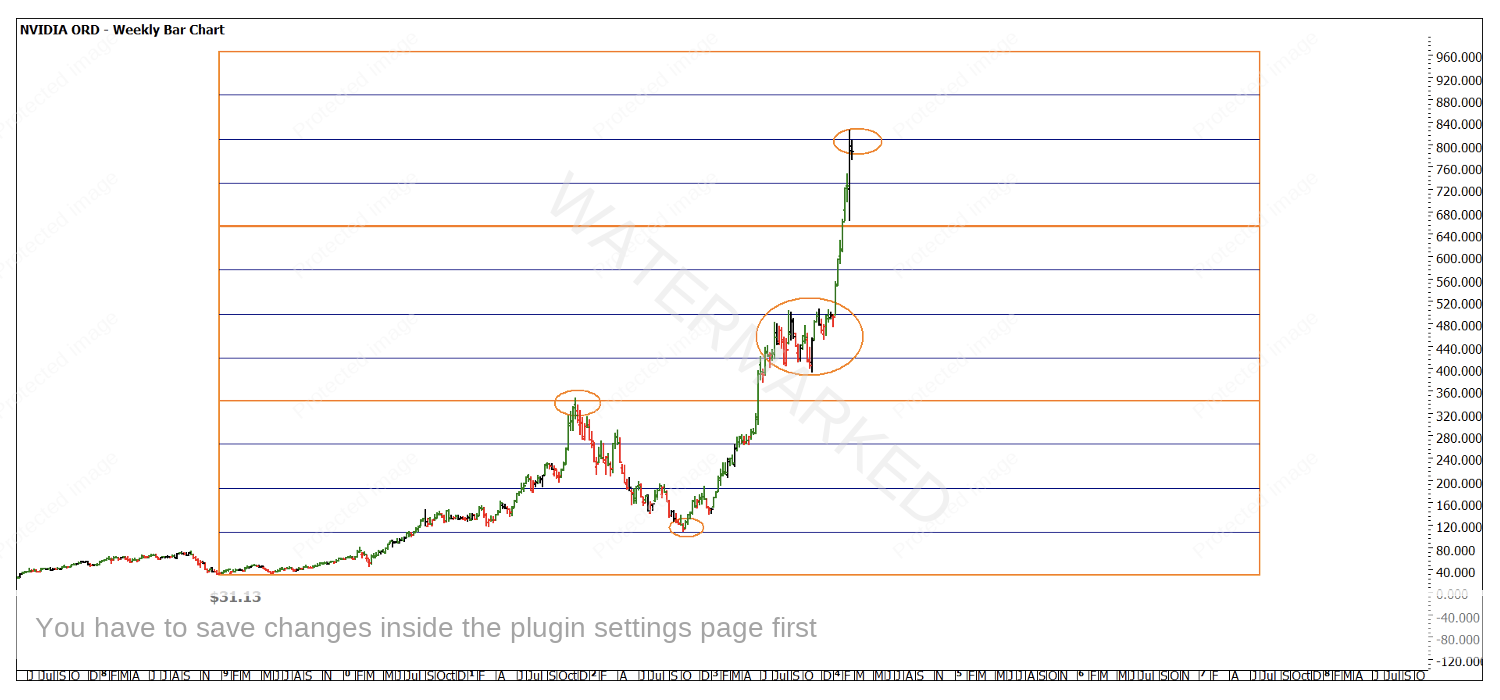
Chart 3 shows us the value of lows calling highs, the low of 2018 was at $31.13 and I have taken that and created a Lows Resistance Card projected up. Instead of a single multiple of $31.13, I adjusted the points size to $0.10 instead of $0.01 and this means each orange horizontal line is 10 multiples of $31.13. This makes the picture clearer and helps us see the bigger picture turns.
Chart 3- NVDA Weekly Bar Chart
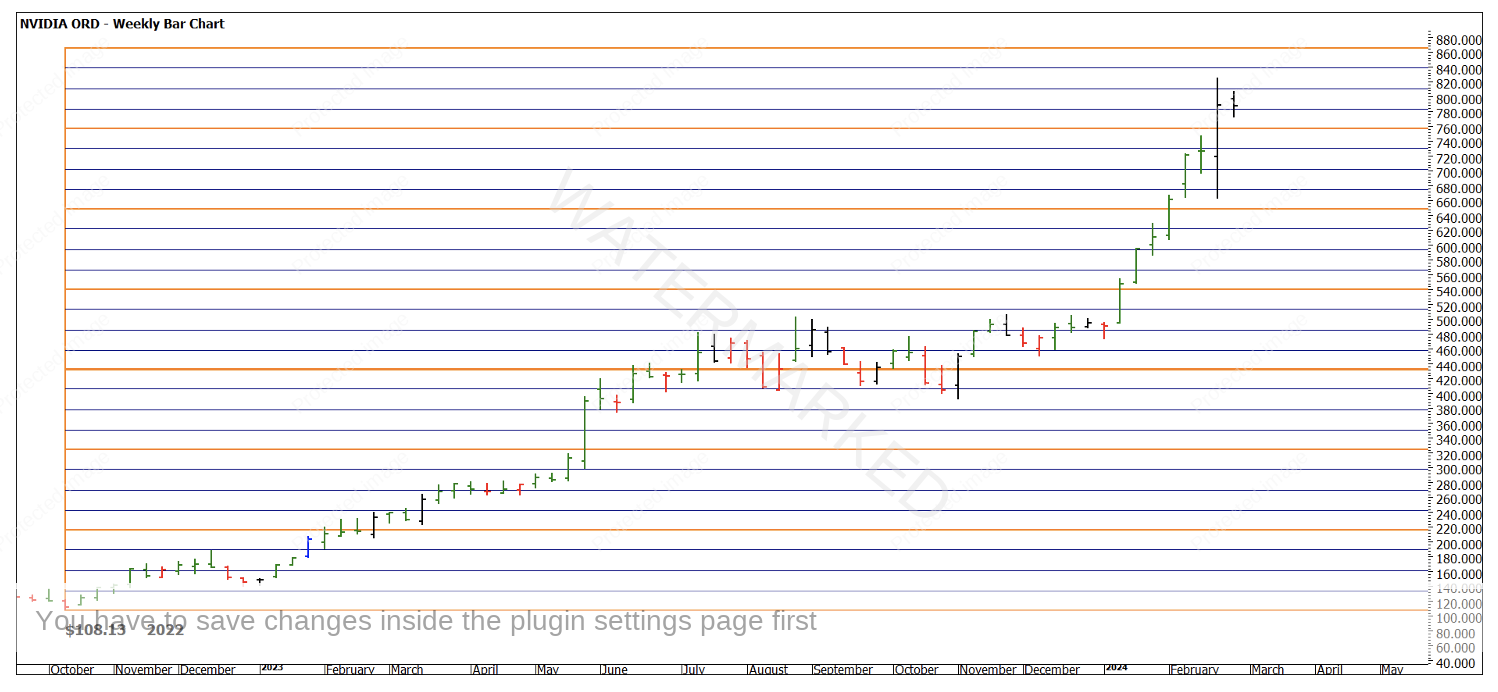
Chart 4 uses a more traditional approach with the low of 2022 at $108.13. The benefit is to understand where to look for areas of support and resistance.
Chart 4- NVDA Weekly Bar Chart
In my experience in a runaway market, particularly in an upside move, the levels from a Low’s Resistance Card can be used as positions to add or pyramid into existing positions. The challenge in this market is not trying to pick tops (which I have attempted to do over the years). Given we see the move up we are keen to participate on a downside move if it arrives.
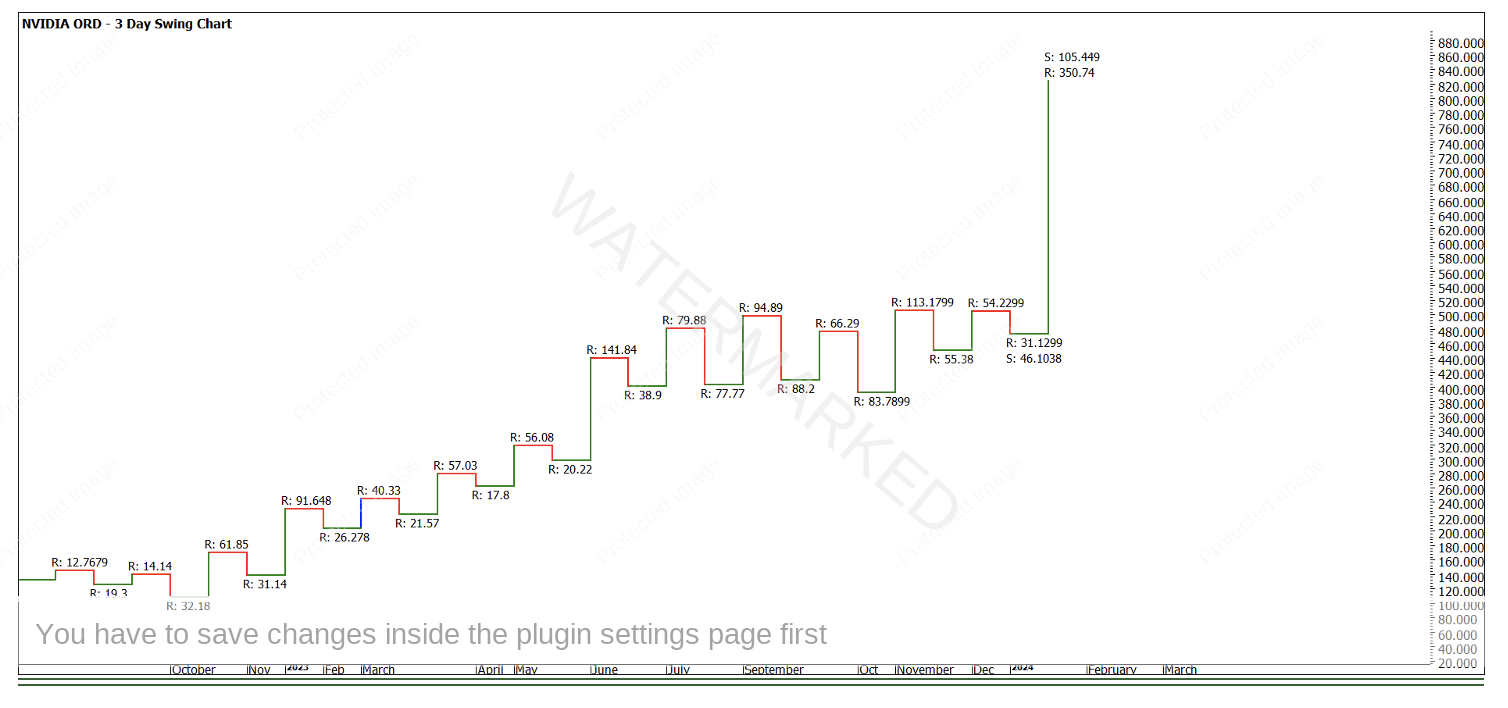
Chart 5- NVDA 3 Day Swing Chart
Chart 5 highlights a stark point in that the current upswing is heavily overbought, but that does not mean it has flown too close the sun and to expect a decline. The current upswing of 350 points is over three times larger than the average of the last 10 upswings. This should help us be wary of adding or opening long positions. Given that 100% of the last major range has also been completed, this is a good time to stalk this market, learn, watch and plan as they are not common and can anchor your response when the next NVDA runaway market arrives.
Good Trading
Aaron Lynch
