Trading the Forecast – BHP
Following on from my article in February, let’s continue our discussion on BHP.
For those who were ready to take advantage of the third section on BHP, you would have done relatively well to date. We explored BHP in the article titled Major ABC’s – Price Forecasting in the February 2019 Safety in the Market newsletter. Despite the data discrepancy that some students experience, the concept was exactly the same, whether you had the old or new data downloaded on ProfitSource. You could (and should) have still applied the same Major ABC’s to the BHP chart. The price would have been slightly different, but you would have learnt a lot more from the concept.
For anyone who still believes they have the old data you can refer to Andrew Baraniak’s General Article from March 2019 titled “ProfitSource Data”. Please note that this article will be referring to the ‘old’ data and is a good opportunity to apply the same concept to the ‘new’ data.
Whether you had time to review the article or not, the question you should be asking yourself is ‘Do you understand the concept?’ The concept is available to us all as Safety in the Market students and should be continuously reviewed and put into practice. The next important question was ‘Did you trade the setup?’
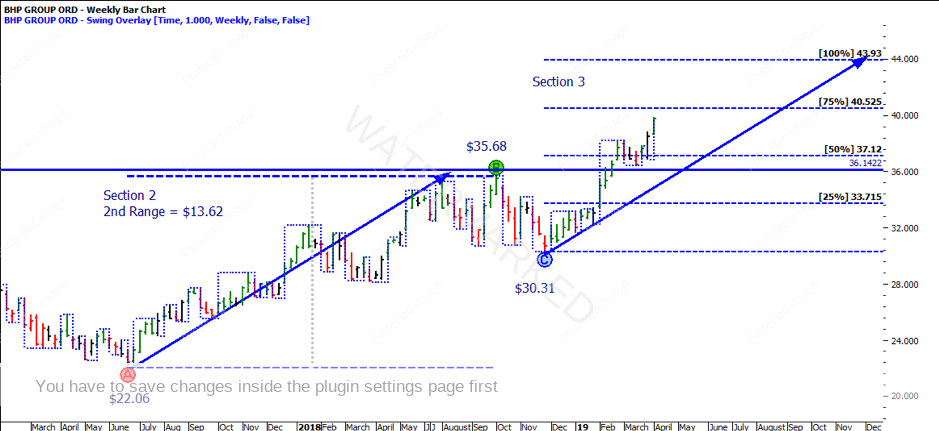
In this month’s article, we are going to review the charts to see how we could have taken advantage of the set up by trading the weekly chart conservatively. Just as a review, the market action in February 2019 had recently broken through the 50% milestone of the major ABC in Section 2. We were of the view that the market was re-testing the old tops before making its new bottom, and in fact it did exactly that, before shooting off.
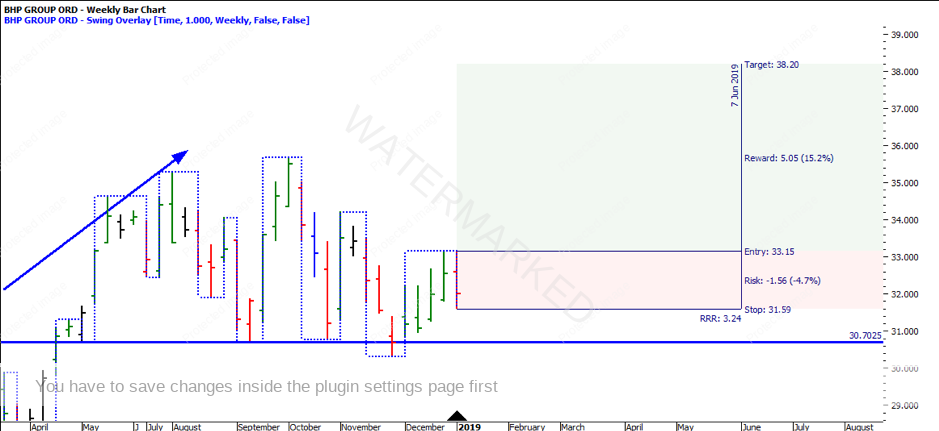
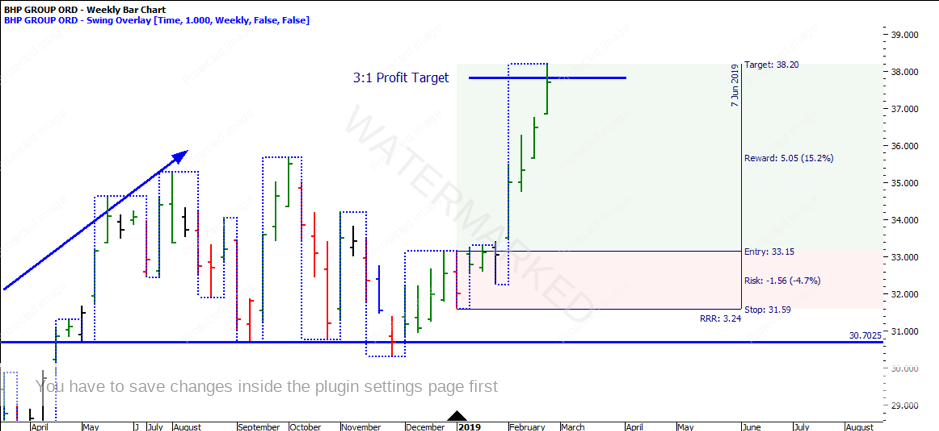
If you had simply traded the weekly chart, you could have entered on the confirmation of a first higher swing bottom. Based on the set up (being the third section) you might have considered taking a split position, whereby taking profit on ½ of the position at 3:1 Reward to Risk and ½ trailing weekly bottoms.
You would have entered the week of 11 January 2019 at $33.15 (1 point above the anticipated Point C). The stop loss would be placed 1 point below the anticipated Point C which was at $31.59. The risk for this trade, therefore, would have been $1.56 per share ($33.15 – $31.59). Assuming you had a $10,000 account and risking 5% of the total account size (5% of $10,000 = $500), $500/ $1.56 gives you a total position size of 320 shares.
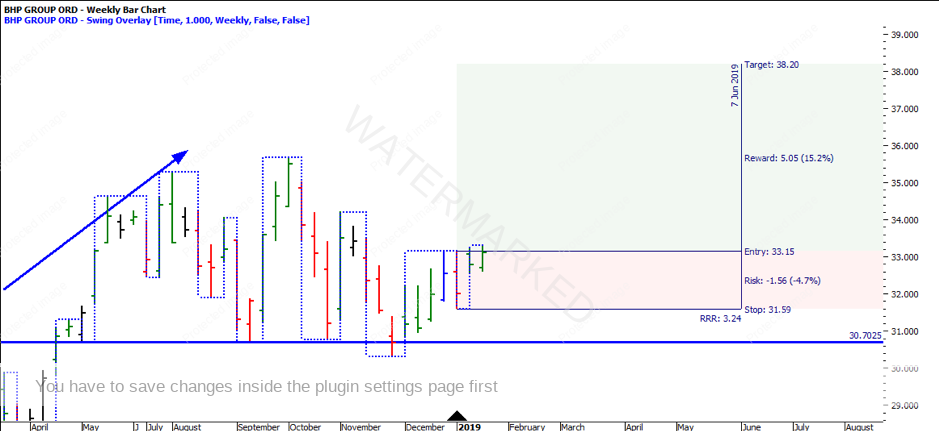
The week you were entered into the trade, you would have finished the week in the red, not giving you much confidence about the setup. However, if you held true to your trading plan, the following week the market rallied back to your entry.
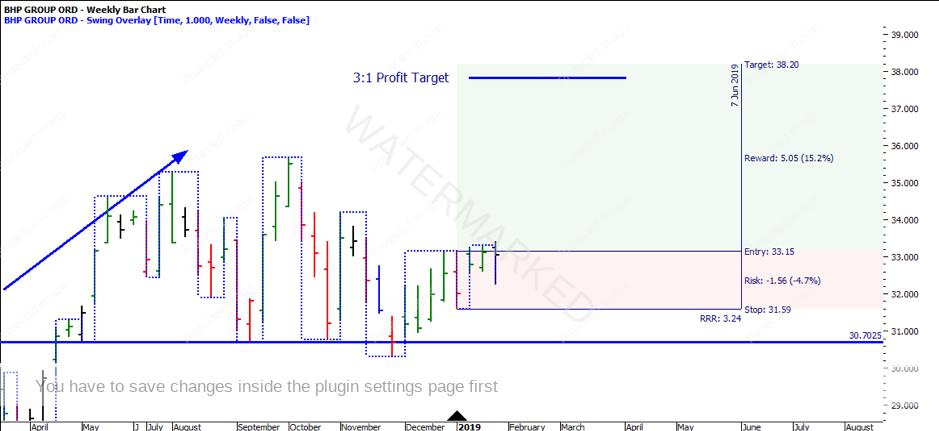
Week three would have caused further scepticism that the trade was going to be profitable and many traders would have cut their loss short instead of remaining calm and following their trading plan.
Those with patience would have been rewarded. The following four weeks proved to be strong, with BHP breaking through the major 50% level of the section two ABC (refer to the first chart). Assuming you were going to take ½ profit at 3:1 Reward to Risk – you would have exited half the position (160) at $37.83. This would have given you a profit (not including costs) of $748.80 ($4.68 x 160), with the remaining profit still in the trade.
As the market continued, the next available opportunity made itself present. Given you had taken profit already on ½ of the original position you would not have any risk on the table. With the weekly chart pulling back, it would have created a weekly ABC long trade.
You could have entered the week of 22 March 2019 at $37.40 (1 point above the anticipated Point C). The stop loss would be placed 1 point below the anticipated Point C which was at $36.44. The risk for this trade, therefore, would have been $0.96 per share ($37.40 – $36.44). Assuming you had a $10,000 account and risking 5% of the total account size (5% of $10,000 = $500), $500/ $0.96 gives you a total position size of 520 shares.
Again, you might have considered taking a split position, taking profit on ½ of the position at 3:1 Reward to Risk and ½ trailing weekly bottoms. Given the current risk on the trade is $0.96, the 3:1 profit target would be $40.28.
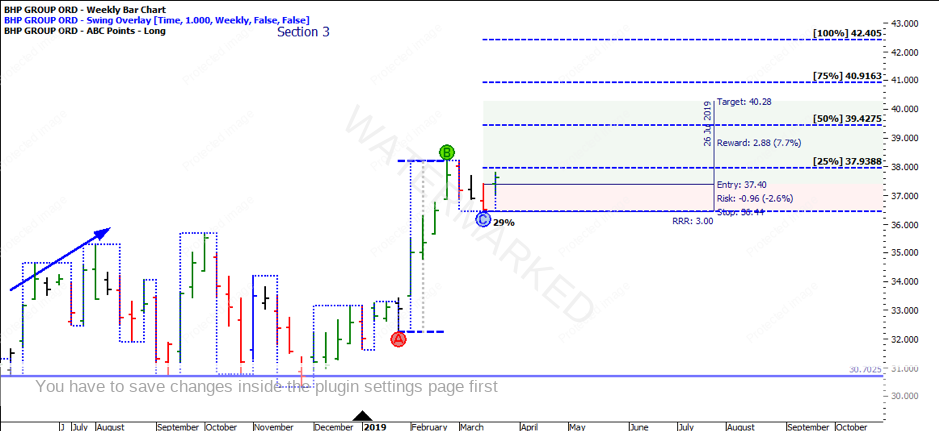
To date, the position would still be open. The first position would have a remaining open position of 160 shares with stops at $36.82. This is approximately a $3.67 profit per share or $587.20 profit (not including costs). The second position would have stops locked in at entry plus commission at $37.45.
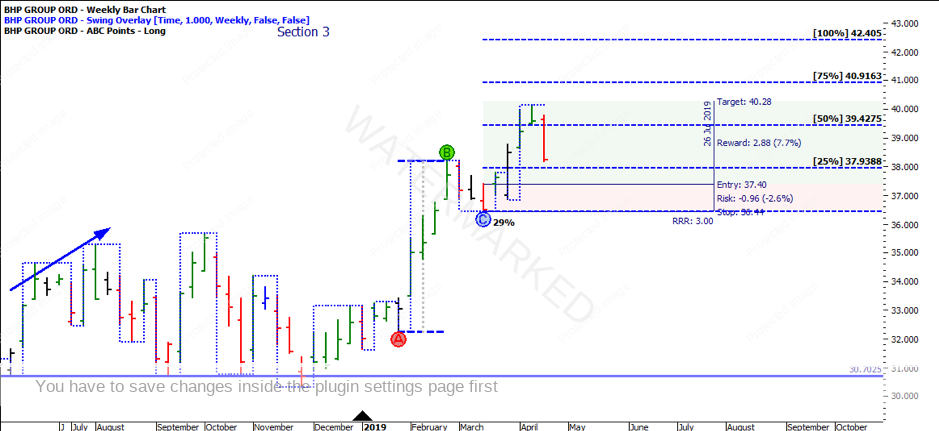
As an exercise, you can replicate the February set up, as well as explore what the results would have been if you traded the daily chart compared to the weekly chart. As mentioned, this article has referred to the ‘old’ data and is a good opportunity to apply the same concept to the ‘new’ data. Look to watch the weekly data unfold and maybe there is an opportunity around the corner.
It’s Your Perception,
Robert Steer
