Trading the Opportunity
An interesting part of the markets is understanding psychological levels or pivotal points that suggest there might be a change in trend to come. Let’s face it, the earlier we can get on the trend the more likely it is going to be profitable. Typically, our Safety in the Market methodology is somewhat scientific and mathematical, using a range of formulas and strategies. Integrating our methodology with the added component of human psychology starts to paint a different picture.
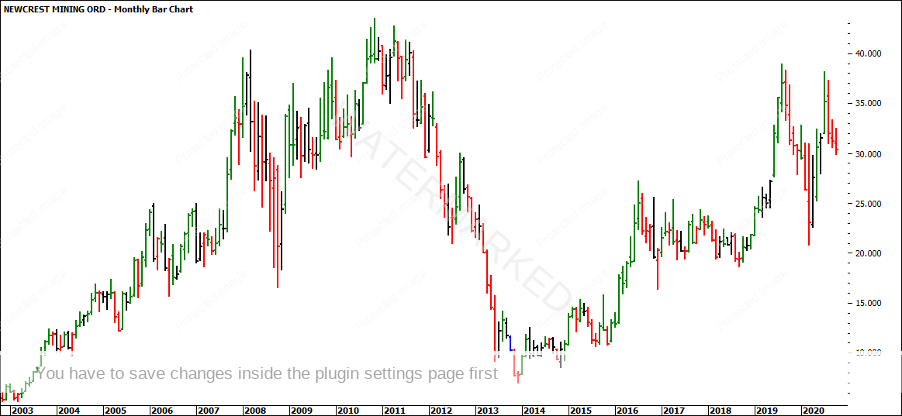
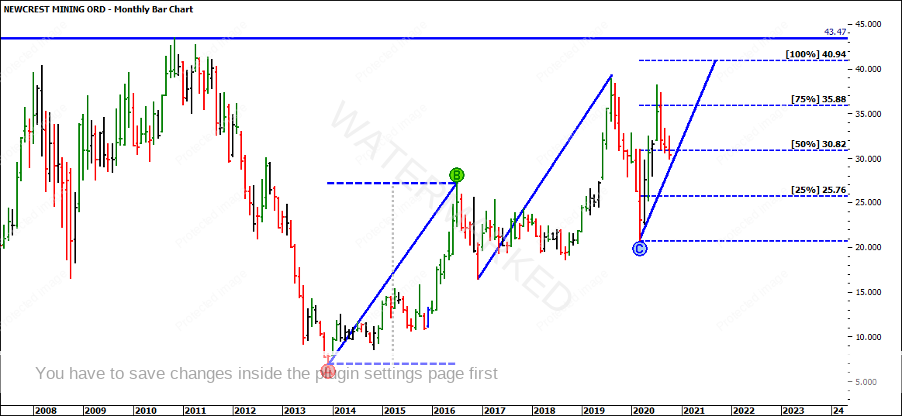
If you refer to the chart below of Newcrest Mining (Code: NCM), you will see that the current market action is gravitating towards the $30 mark. Gann speaks of the importance of the number 30 stating that:
30-Year Cycle: “The 30-Year Cycle is very important because it is one-half of the 60-year cycle or Great Cycle and contains three 10-year cycles. In making up an annual forecast you should always make a comparison with the record 30 years back.”
He talks about the 30-year cycle, though the actual numeral 30 is very important. As per the chart, this is an area that NCM has made a previous top and bottoms in its history. It is obvious that the market likes to gravitate around the $30 level and this can be used to your trading advantage.
Based on the most recent market action on NCM, we can confirm that this was a tactical move by the bears pushing the price into the $30 psychological level before potentially finding support followed by an opportunity. With the above being more of an observation and not a statement, we, therefore, need to verify the market action.
This sort of set up is often a trading opportunity on a market. They can be identified where a market reaches a pivotal point in both time and price, whether that be resistance, support or a psychological level. A market may be trading within a specific channel range for an extended period of time, fluctuating between support and resistance or it can make an aggressive move into a common/ psychological level.
NCM is often correlated to the movements of gold. Having come across this pattern multiple times, it makes it relatively easy to determine the likely scenario to follow. Those who pay particularly good attention will know that this set up has been spoken about in previous articles.
The idea is to follow the set up through to the end (patience) and build a trading plan around the likely scenarios. Whether the market finds support or resistance on this level there were two likely outcomes that you could have taken advantage of. It’s more about choosing your battles and very much goes back to David Bowden’s comment around hindsight becoming foresight IF it is used often enough.
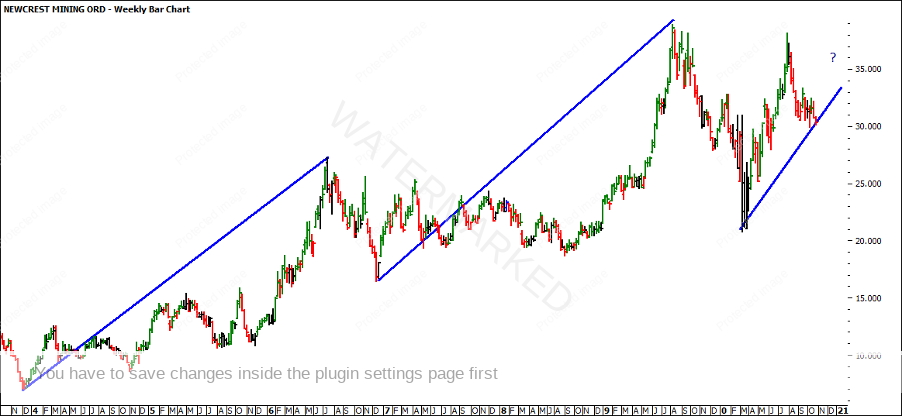
If we take a step back and review the market action over the past 5 years, you’d be able to identify that there are two clear sections, and we are currently in the third section. While the trading opportunity might not be prominent today, in the future when a market reaches a pivotal level, you can start planning the strategy to profit from the expected increase off the pivotal level.
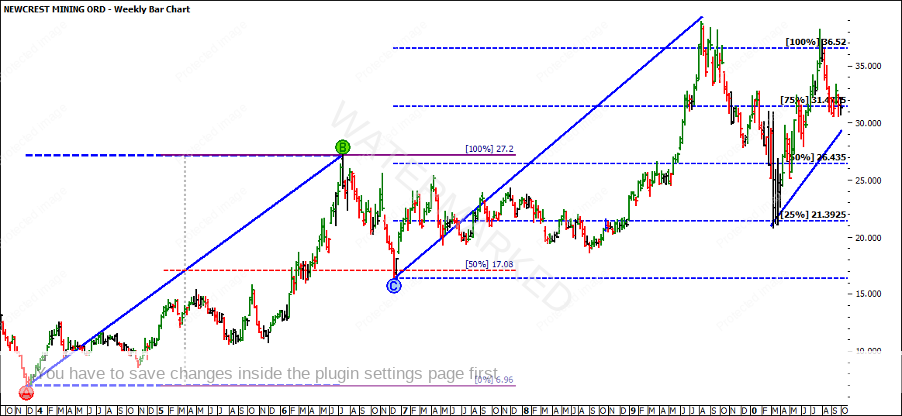
In the chart below, the weekly chart shows the harmonic relationship between section one and two, having the FRO rally and find support on 50% before repeating the 100% range of the FRO. It also shot through the 50% of the second range out due to the fast COVID crash that was experienced but rallied just as powerfully out, providing a textbook overbalance in price trade.
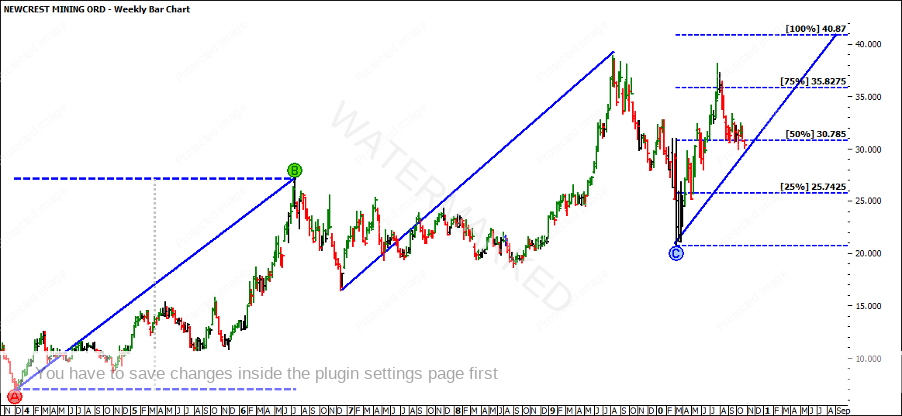
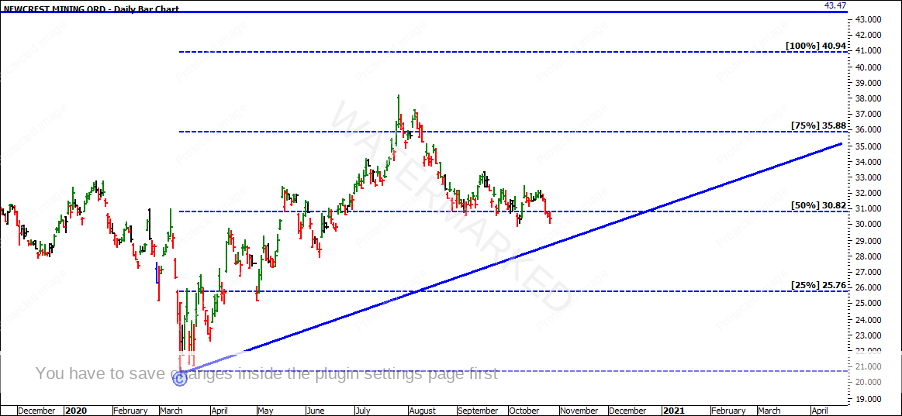
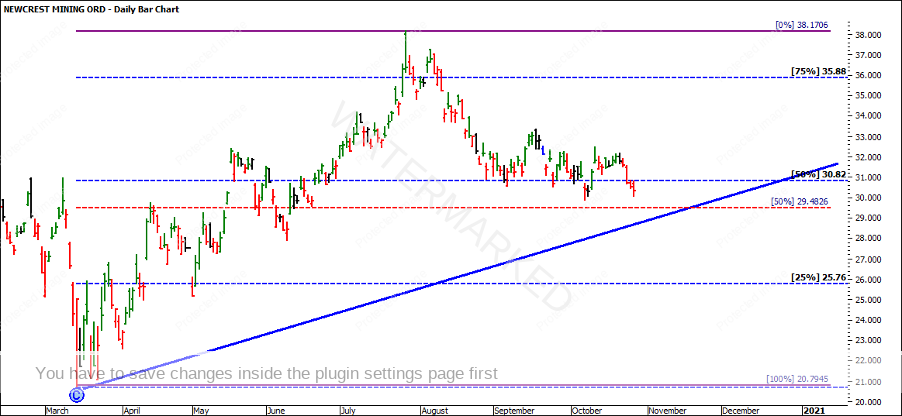
As per the market today, projecting the FRO out from the bottom of the COVID low, the market has gravitated to the 50% level of both the FRO as well as the Ranges Resistance Card for the section, as you’ll see in the next chart. The 100% level sits at $40.87, which lines up very closely to the ATH on NCM.
Regardless of the longer-term perspective though, the question is, is there a trade available today?
To date, we have seen the market has found support on both the FRO Milestone 50% and hovers above the 50% of the Ranges Resistance Card. This may be seen as the winter of the bear trend. Waiting for further confirmation on the bigger picture would be the smart way to go. A break of the $29.48 level is likely as well, so preparing yourself for multiple outcomes is taking advantage of the trading opportunity. Alternatively, the accumulation along support prior to testing the ATH would be attractive. Let’s have some patience to see how the weekly swing chart reacts for future long-term opportunities.
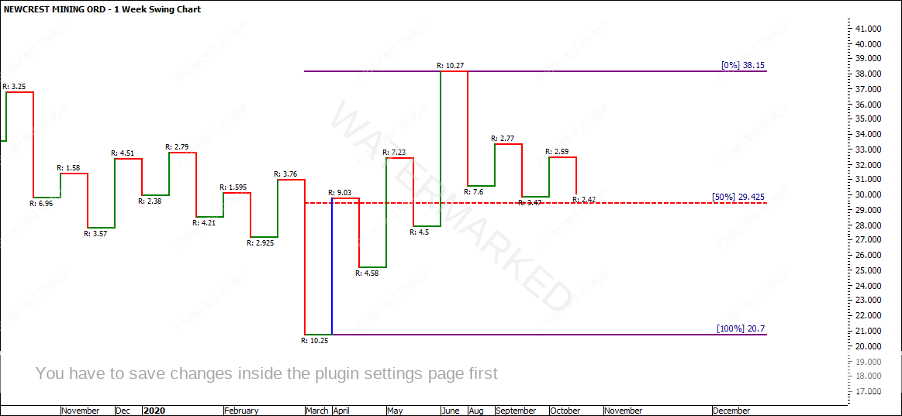
The swing chart is often the most helpful in anticipating the direction of the market. While the facts are the numbers, we also often have pre-determined ideas about what should happen which causes humans to be irrational when it comes to trading. Whether that be a potential change in trend or an explosive break, it will be the swing charts that keep us trading in the direction of the trend, so have faith in the numbers.
In the weekly chart below, there was a range of 7.6 after a very strong move to the upside of 10.27. The market failed to recover only showing an upside of 2.77. As the market found support at 50%, the weekly downswings have started to contract, and the upswings have started to contract. This is an obvious sign there is uncertainty coming into the market, and that means there is an opportunity to follow.
Like always, this article isn’t suggesting exactly what is going to happen, but as mentioned we are at the start of a potential move in either direction and therefore it is important to build the likely scenarios or outcomes so that you can have an open mind. Remember to trade in the direction of the trend and as David Bowden says, we don’t want to be anticipatory stupid.
It’s Your Perception
Robert Steer
