Trading with a Strong Trend
If you’ve been looking for a strongly trending market to trade lately, just look for one whose name begins with a C then an O. Sometimes it can be that simple. Corn, Copper and Cotton. Even Coffee is showing signs of roaring to life at the time of writing, and don’t take your eye off Cocoa. Between last year, and this year so far – finally some decent volatility has returned to these markets.
This month’s article again features the Cotton market, but this time it’s not about calling a major top or bottom. It’s about identifying and trading a price cluster from the smaller picture while trading in sympathy with the existing weekly uptrend.
The trade entry took place on the 22nd of December (New York Time), and the instrument used was the March 2021 Cotton futures contract. While a standard, high probability daily chart ABC long trade was available at that time in this market, the trader who watched things more closely had the chance to trade with a much higher reward to risk ratio.
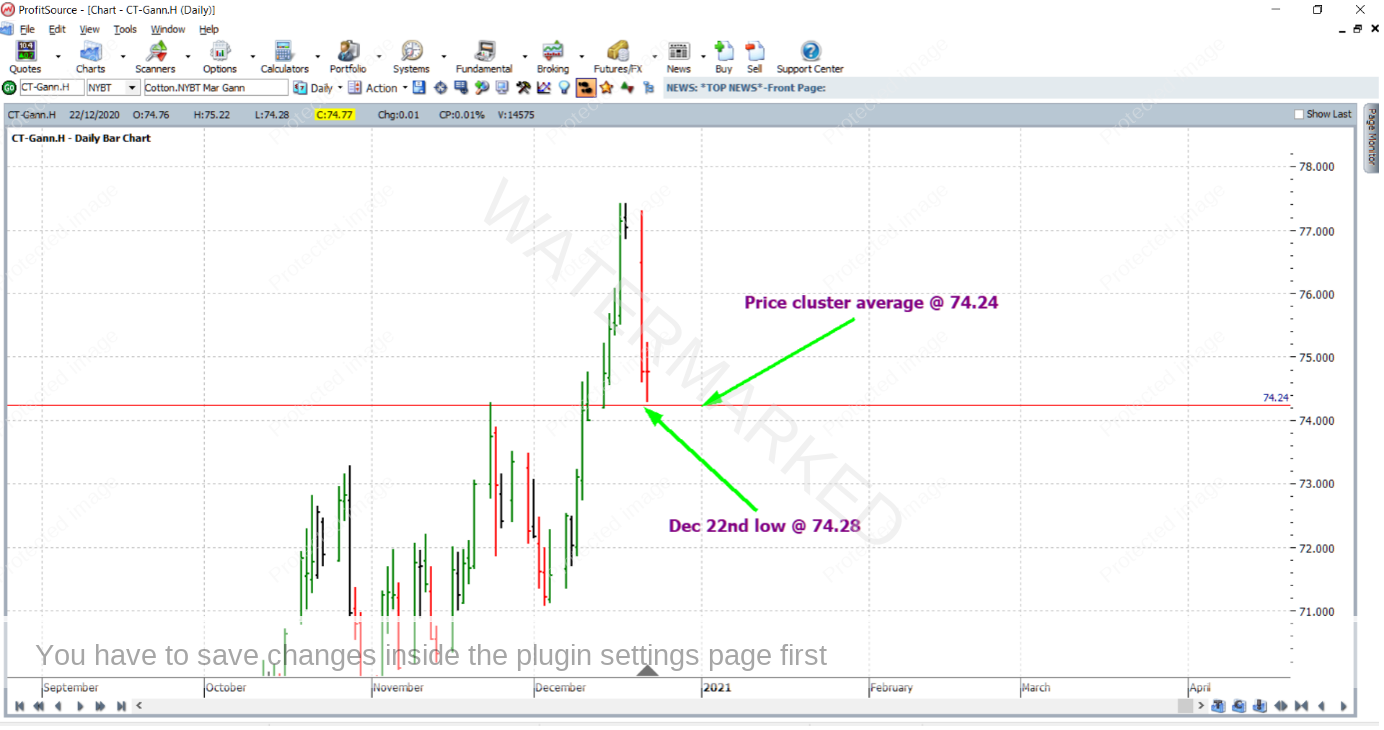
A good Price Forecasting routine can have us ready to buy when a market comes down and sits on top of a price cluster. On the 22nd of December 2020 the Cotton futures March 2021 contract came to a low price of 74.28 cents per pound. There were three Price Forecasting reasons in favour of this as a tradeable low. They averaged out at 74.24 and this is illustrated in the chart below (code CT-Gann.H in ProfitSource) in Walk Thru mode. The actual low of the 22nd came in at 74.28, with the 4 points of error being quite small in relation to the average size of a daily bar.
Two of the price reasons were from the smaller picture, and one was from a much bigger picture turning point. If you’d like some practice, see if you can find these reasons on the CT-Gann.H chart.
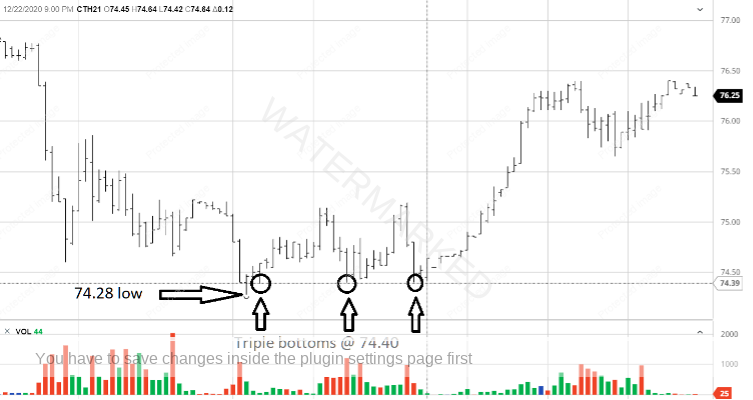
Don’t forget that a long trade here also had Major Trend Sympathy in its favour (Weekly Swing chart trend was UP). In addition to this there was a very clean set of triple bottoms on the 30-minute intra-day bar chart (from barchart.com) at a price of 74.40, which was comfortably above the price cluster at 74.24 and the final low of 74.28 – see the chart below.
And finally, there was at least one simple and solid piece of time analysis, but that’s beyond the scope of this article.
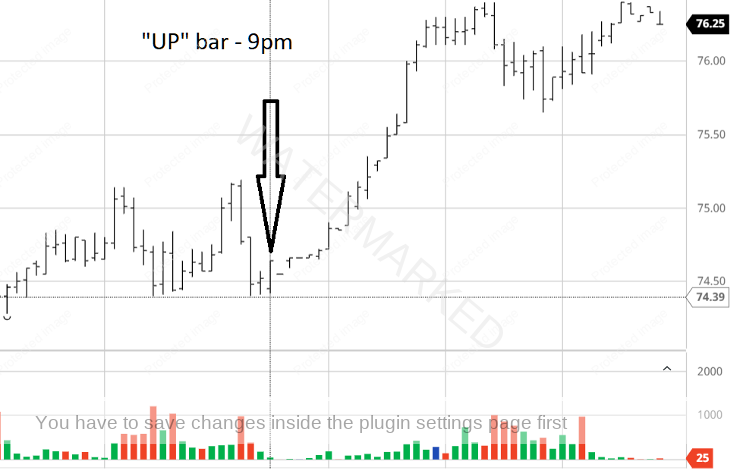
Now with the analysis complete, let’s consider the trade entry. With strong enough reasons to trade, we can take a more aggressive entry by means of the intra-day chart. Let’s again consider the 30-minute bar chart. The 9pm bar (local New York time on the 22nd) was an UP bar – turning the 30-minute swing chart up after the 3rd of the triple bottoms outlined above. Entry stop will have been placed at 1 point above the high of the 8.30pm bar at 74.58, with an exit stop-loss at 74.39 – 1 point below the lows of the triple bottoms.
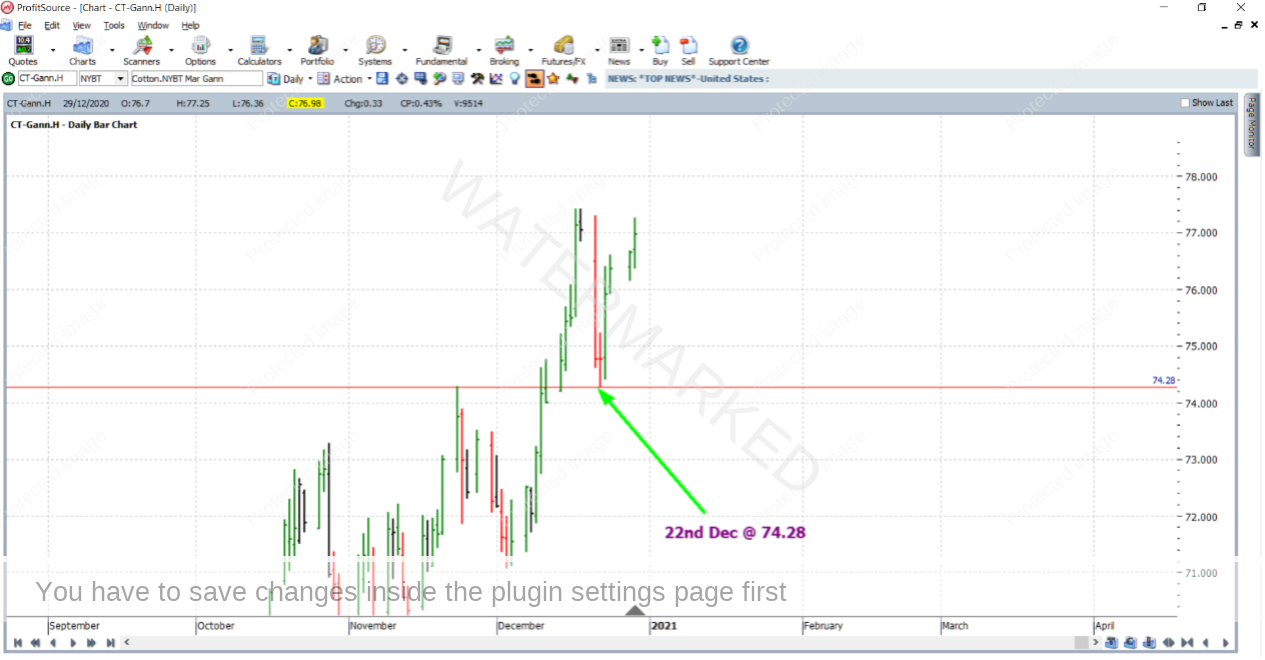
The strong run-up after entry is obvious on the above intra-day chart. Here is what the situation looked like on the daily chart a couple of days after the abovementioned entry:
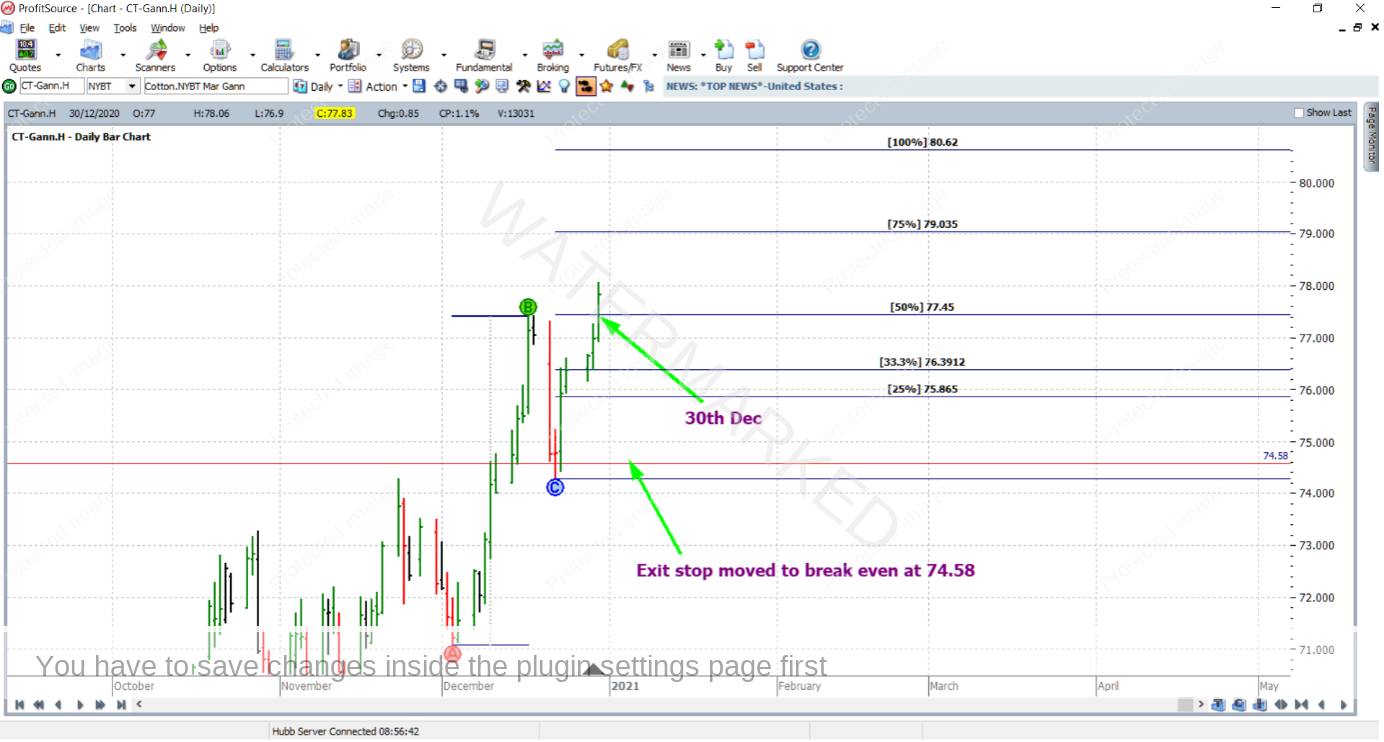
Now onto the trade management. Let’s use the range from December 3rd to December 17th as the reference range and manage the trade like a normal ABC trade managed “Currency” style. On the 30th of December, the market cleanly broke through the 50% milestone – and stops were moved to break even.
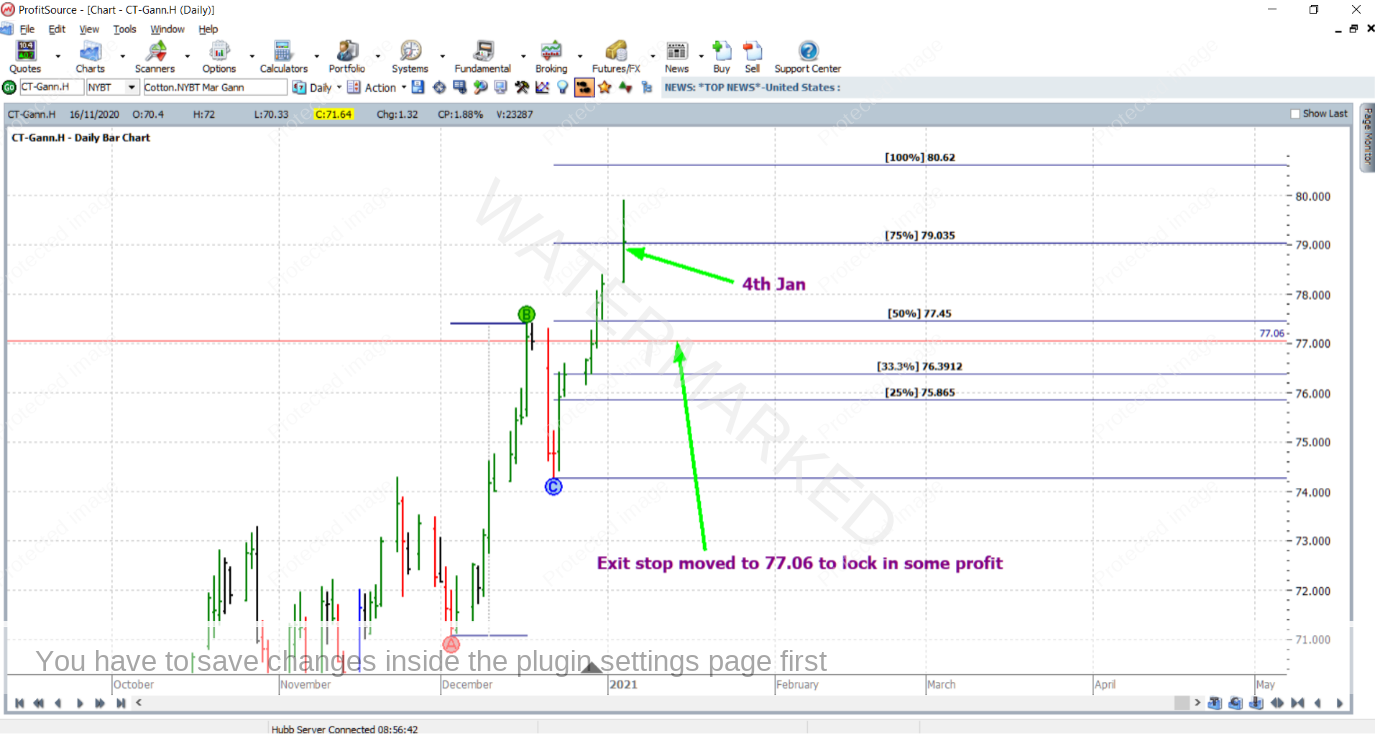
Then on the 4th of January, the market broke through the 75% milestone. In this case, stops were moved to one-third of the average daily range (39 points based on the last 60 trading bars) below the 50% milestone – to lock in some profit.
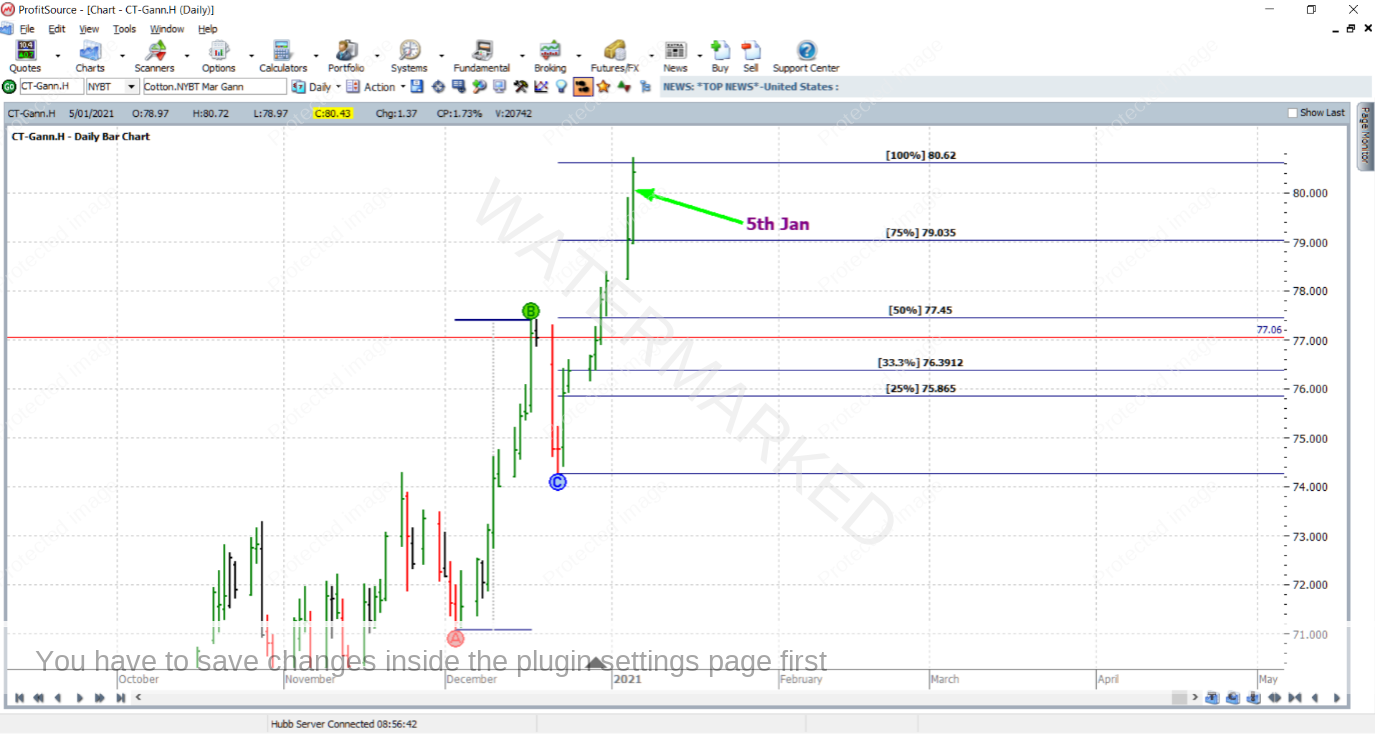
And finally, on the 5th of January, the market reached the 100% milestone and the trade was exited at a price of 80.62.
And now to calculate the rewards:
In terms of the reward to risk ratio:
Initial Risk: 74.58 – 74.39 = 0.19 = 19 points
Reward: 80.62 – 74.58 = 6.04 = 604 points
Reward to Risk Ratio = 604/19 = 31.8
In absolute dollar terms:
As mentioned last month, Cotton futures are traded through the ICE Exchange. Each point of price movement changes the value of one Cotton futures contract by US$5.00. So the absolute risk and reward (in USD terms) for each contract of the trade was:
Risk = $5 x 19 = $95
Reward = $5 x 604 = $3,020
Having taken a very aggressive intra-day chart entry, let’s assume that a conservative risk of 2% of your account was taken. With an account worth US$10,000 this is obviously a $200 risk, which could afford you the risk of trading two contracts, for a USD reward of $6,040.
Finally, let’s calculate the reward in terms of a percentage gain in account size. Trading two contracts the percentage gain would be calculated as follows:
$6,040/$10,000 = 60.4%
Work Hard, work smart.
Andrew Baraniak
