Trading with the Trends
As the major indices continue to rise, I can only imagine what will be the trigger for a change in trend. In terms of a political or macroeconomic space It’s not something I’ve educated myself in, so I find it easier to trade with the trend and be guided by the swing charts.
Looking at the Mini Dow Jones EYM-SpotV, this market has pushed through four previous swing highs to now find a higher bottom on these levels. This would indicate to me a significant sign of strength.
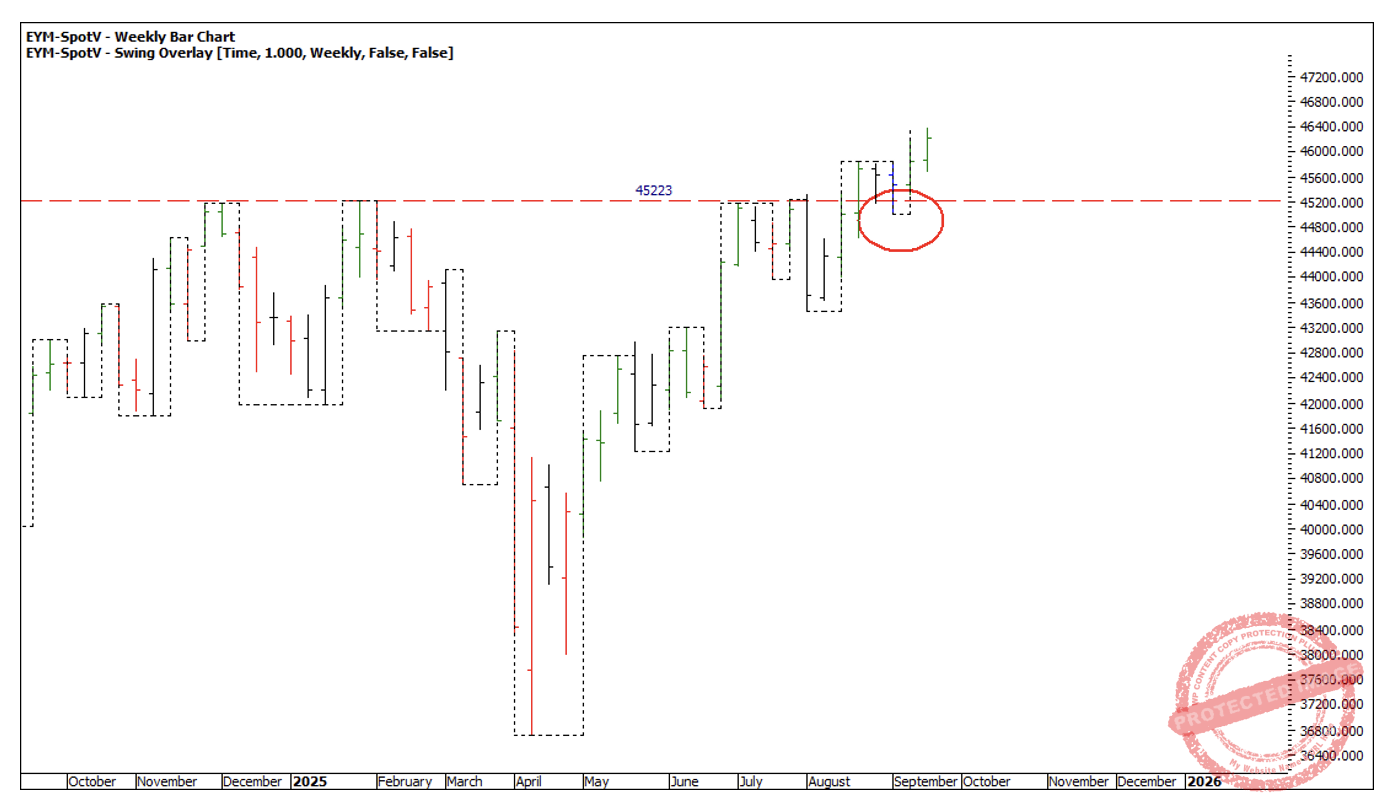
Chart 1
Looking at my major bar charts with the swing chart overlay, I really want to understand the big picture direction and where the big price milestones are clustering together.
This is important because I need to know the main direction to trade so I don’t look back in years to come and wonder why I was always trying to short in a big bull market!
The yearly bar and swing chart is showing very bullish signs, a yearly low on a near perfect 50% retracement, sitting on a previous yearly swing high and in terms of form reading, the current bar is a yearly outside continuation bar, another sign of strength. The next price milestones ahead show 75% at 49,133, just short of 50,000 points. When the market gets there, you can guarantee there will be talk about it in the news!
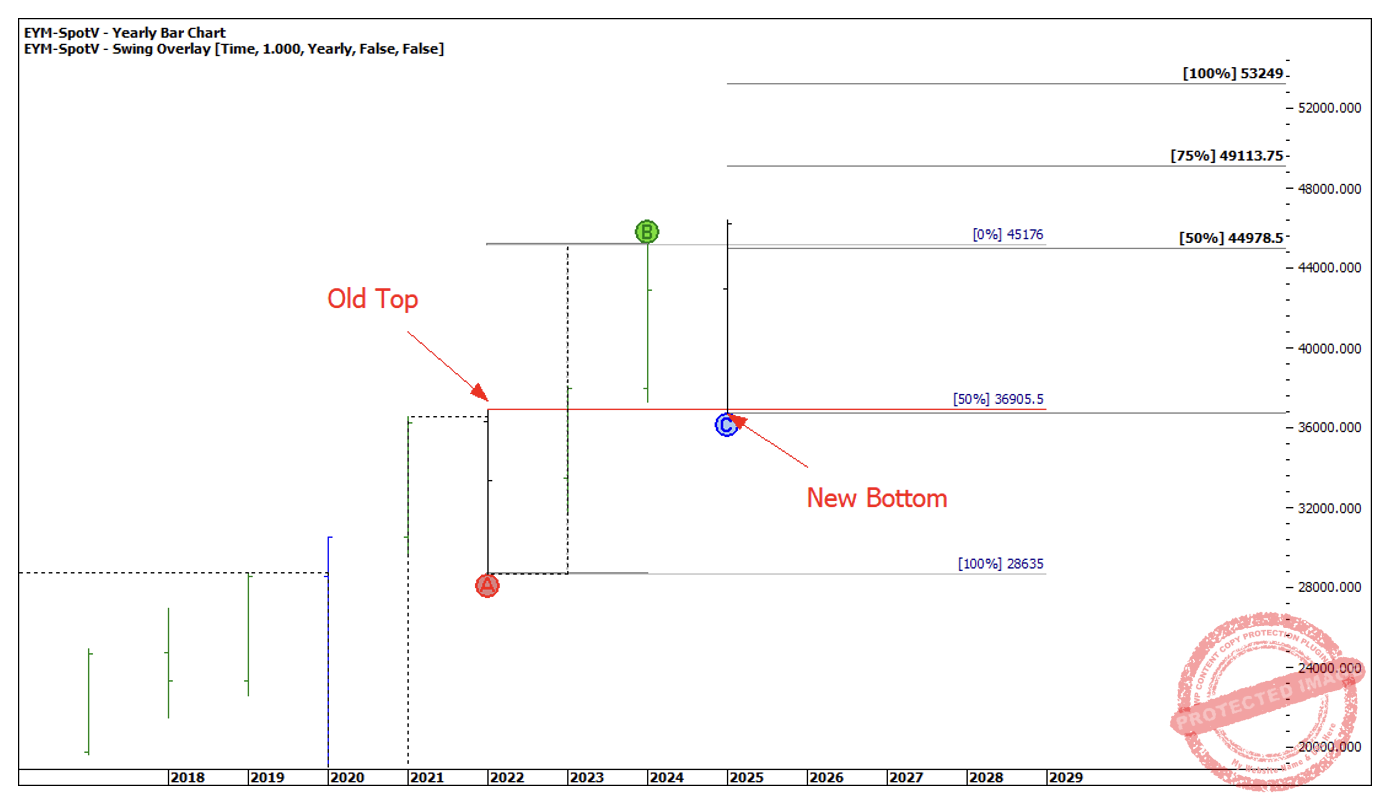
Chart 2
Now the Wheels within Wheels of swing charts mean we now drop down a time frame to the quarterly swing chart. The 100% quarterly swing milestone is 49,526. At this stage this suggests to me, if the Dow can push through the current 75% price milestone, then around 49,000 is the next place to watch for support or resistance and I should only be looking to trade long, and any sell offs are buying opportunities.
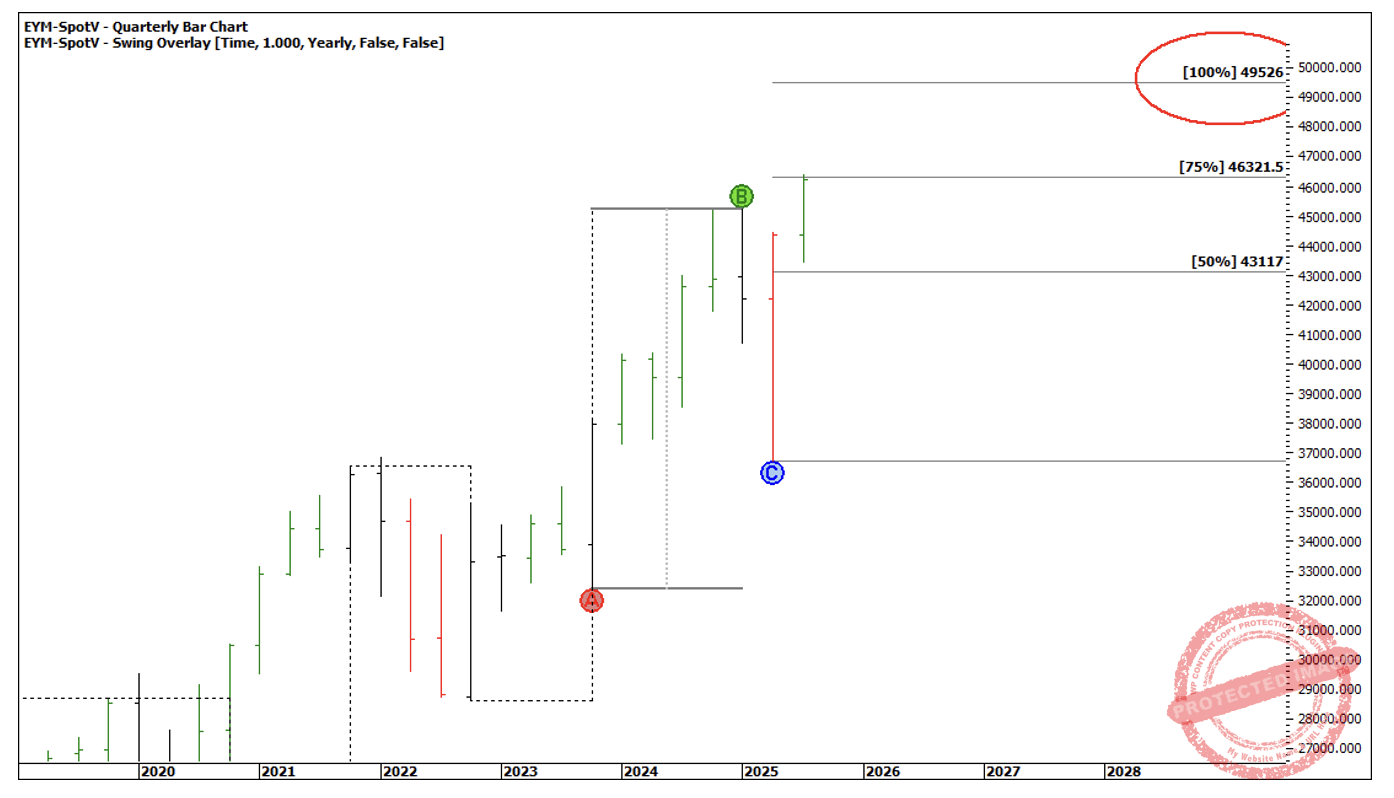
Chart 3
Dropping down to the monthly, it appears that the Dow is in its second section up. The 50% milestone shows a price of 47,766 which doesn’t cluster with anything else at this stage.
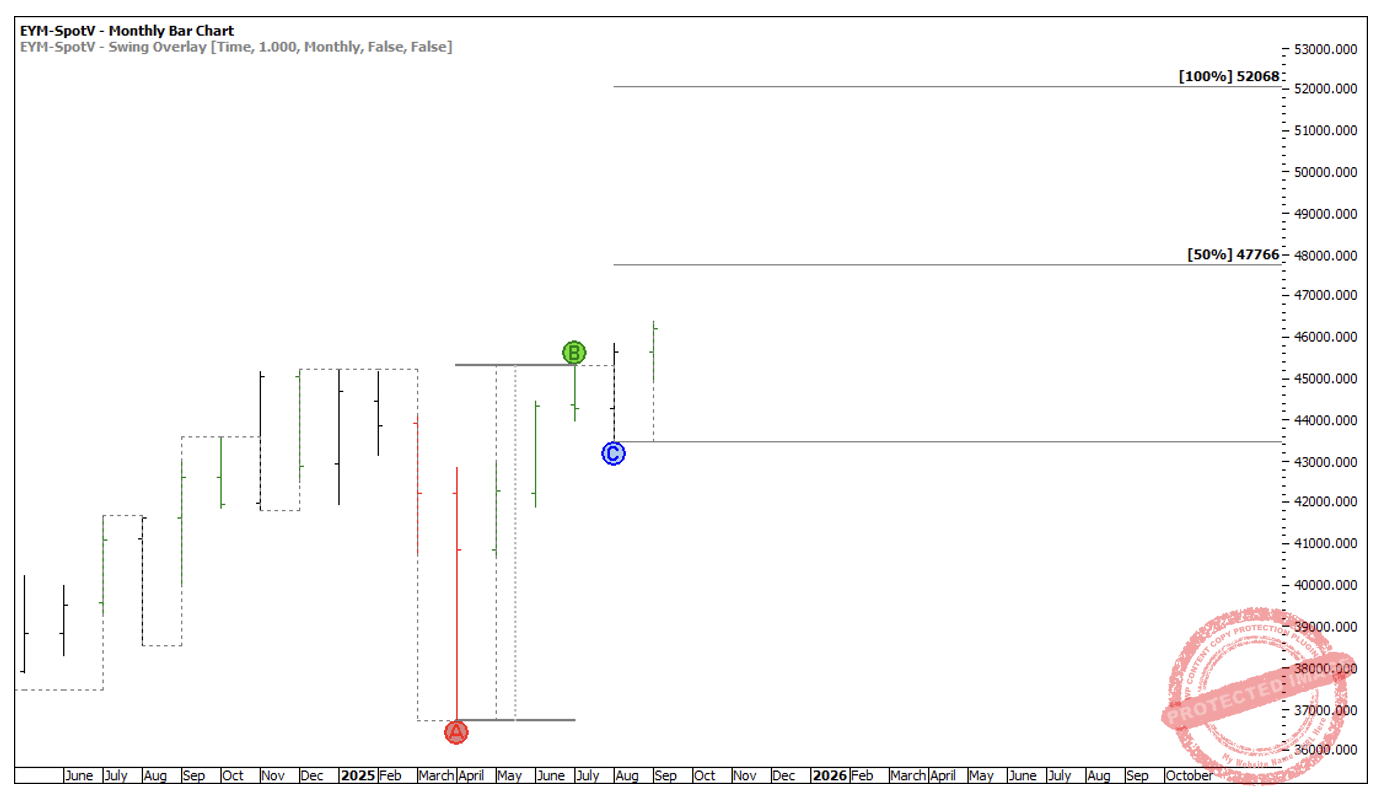
Chart 4
Now the weekly swing chart is showing the next major milestone to watch is 100% and a price of 47,377.
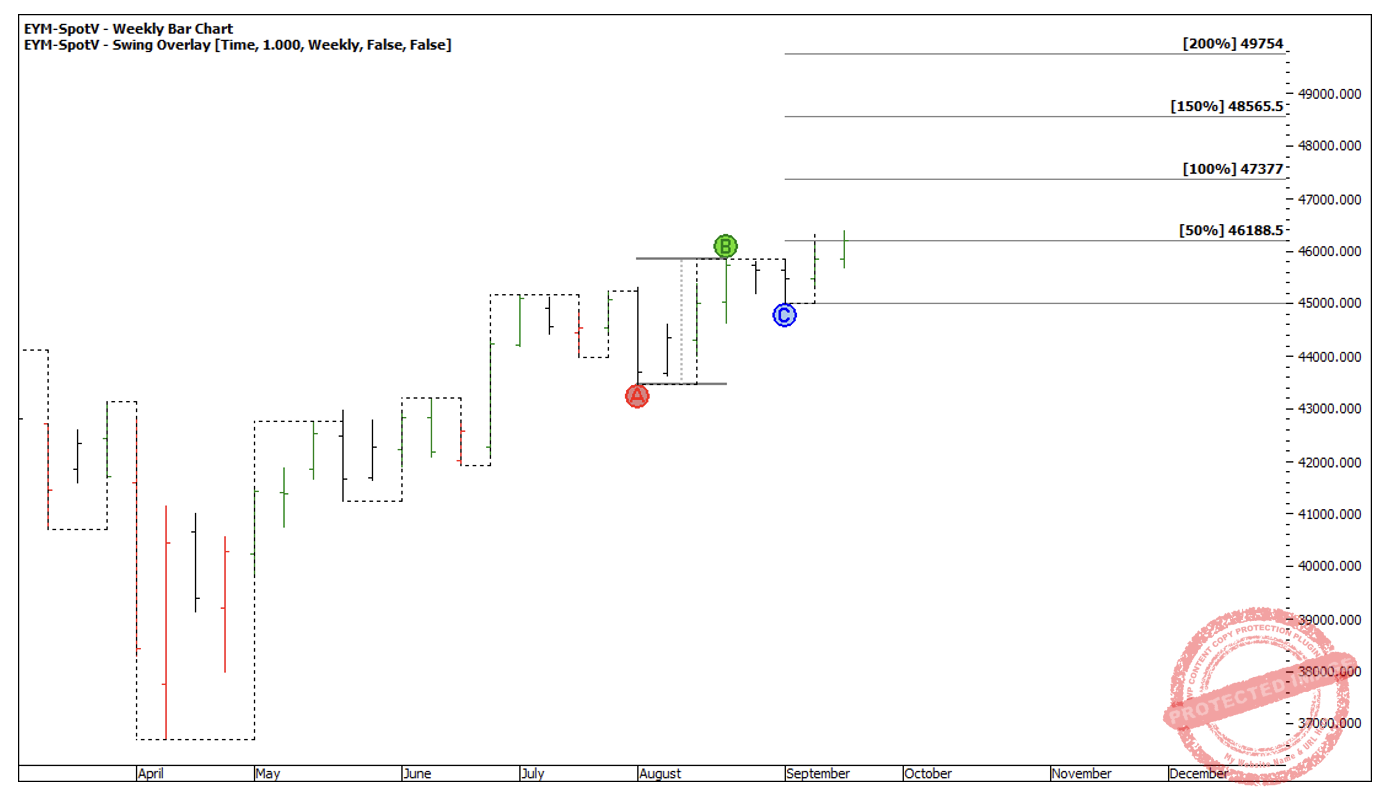
Chart 5
With 50% of the monthly swing in close proximity, and 100% of the weekly swing milestone around 47,300-47,700, I was looking to take a trade. I would like to see the Dow push through these milestones then come back and put in a weekly swing high on top, making this price support. You could then look for a long opportunity that has you trading in sympathy with the weekly, monthly, quarterly and yearly swings charts!
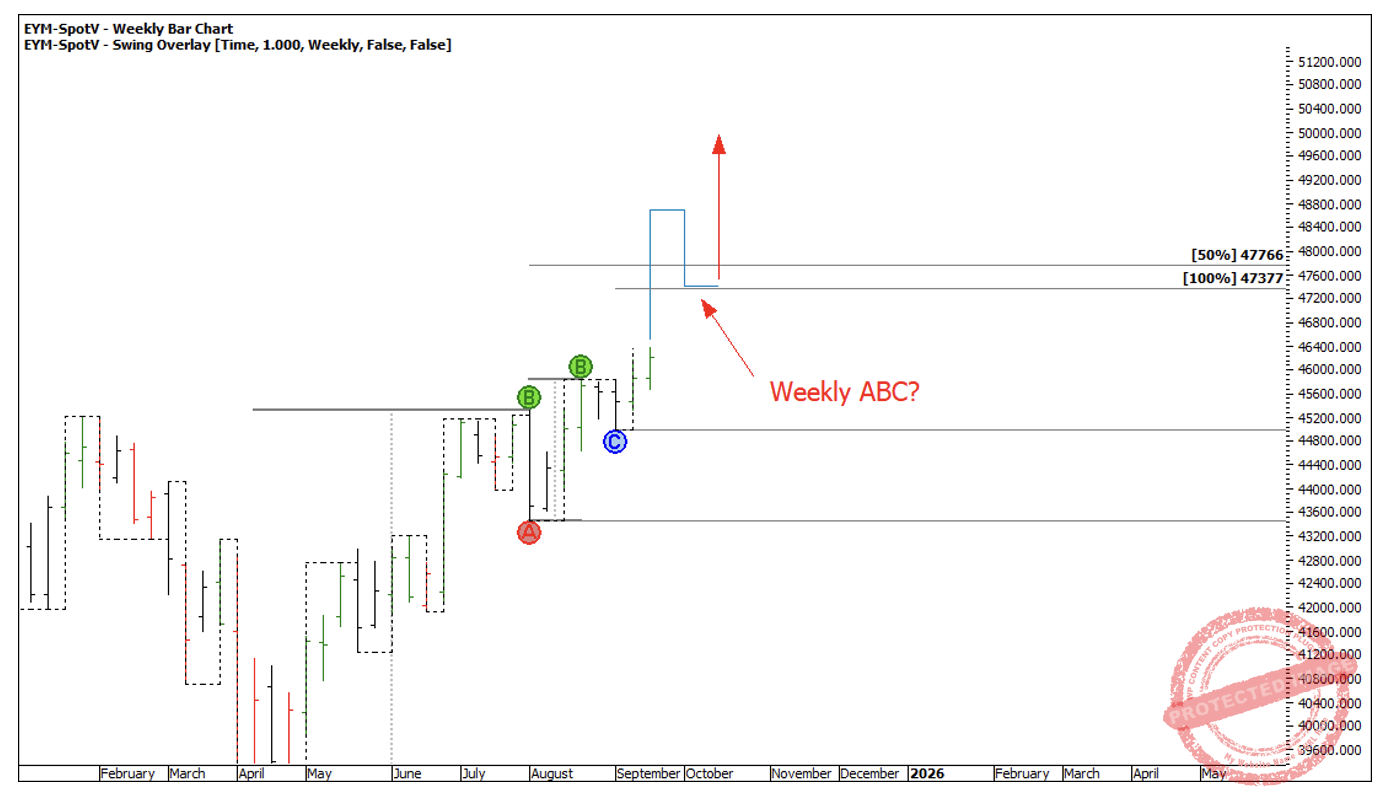
Chart 6
My initial process for dissecting a market and understanding its big picture is exactly what I’ve outlined above. Once I’ve done that, then I can start to look at some other techniques like roadmaps to support my swing chart analysis. Then I can start to look at other time techniques like Time by Degrees which David teaches you in the Ultimate Gann Course.
Just for some food for thought, we are approaching the 100-year anniversary of the 1929 stock market crash. Maybe it’s also worth looking at 1925 for any similarities.
It seems to me the real opportunities in this market are on the long side. That doesn’t mean I don’t rule out the possibility of any significant pullbacks or even being wrong, but the swing charts guide my direction and give me the framework as to which direction to trade.
Happy trading,
Gus