Trading with the Trends Continued
Last month I left you with one potential scenario on the Mini Dow (EYM-SpotV in ProfitSource), for a trade setup to form. Re-reading last month’s article I realised I hadn’t run a ‘Data on Demand’ and was about 4 weeks behind in data! My apologies on that!
Still the setup remains valid and if I refer to Chart 6 in last months article, I was looking for a Weekly ABC, with Point C support on top of the price milestones in new all-time highs.
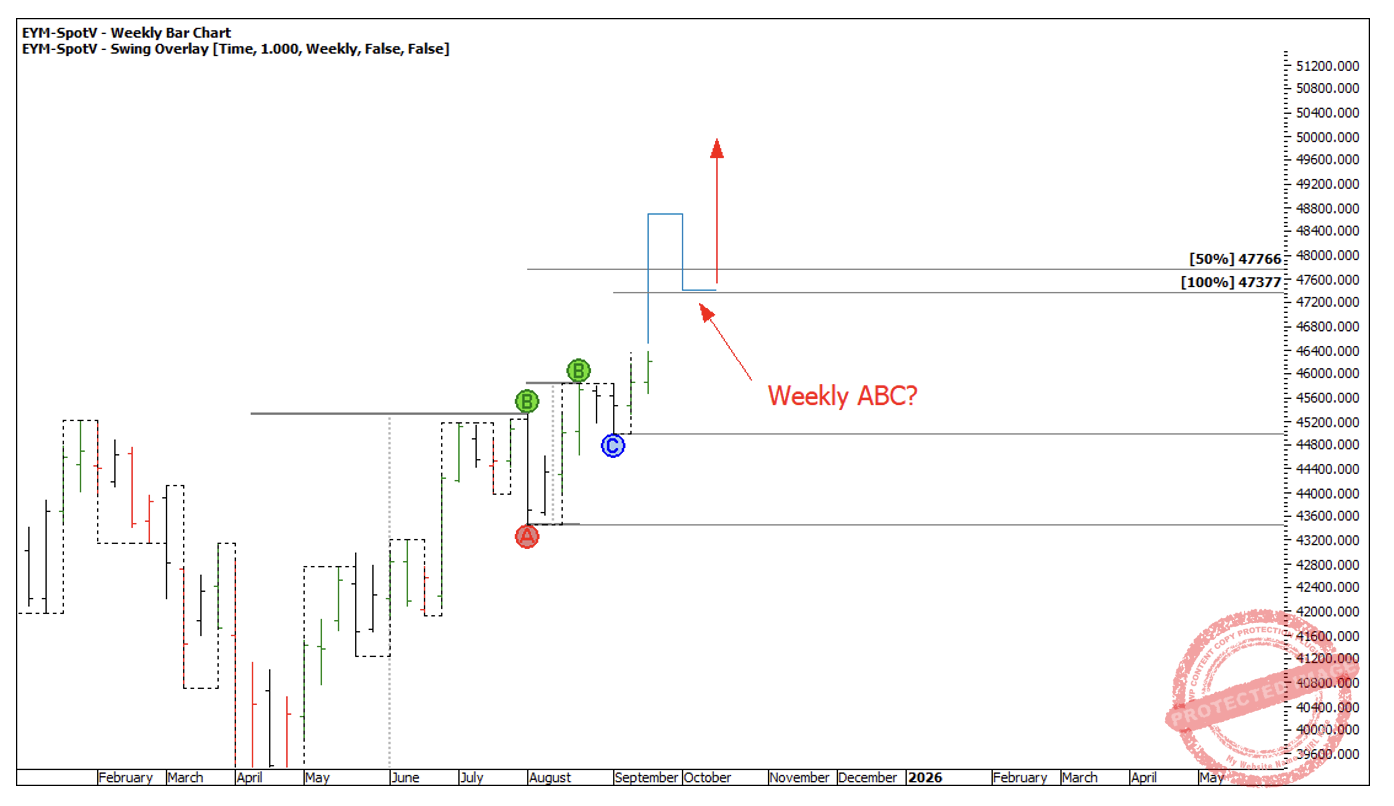
Chart 1
Now with an updated ‘Data on Demand’ I can see the market had just failed to reach those milestones and had a solid week down into a 10 October low.
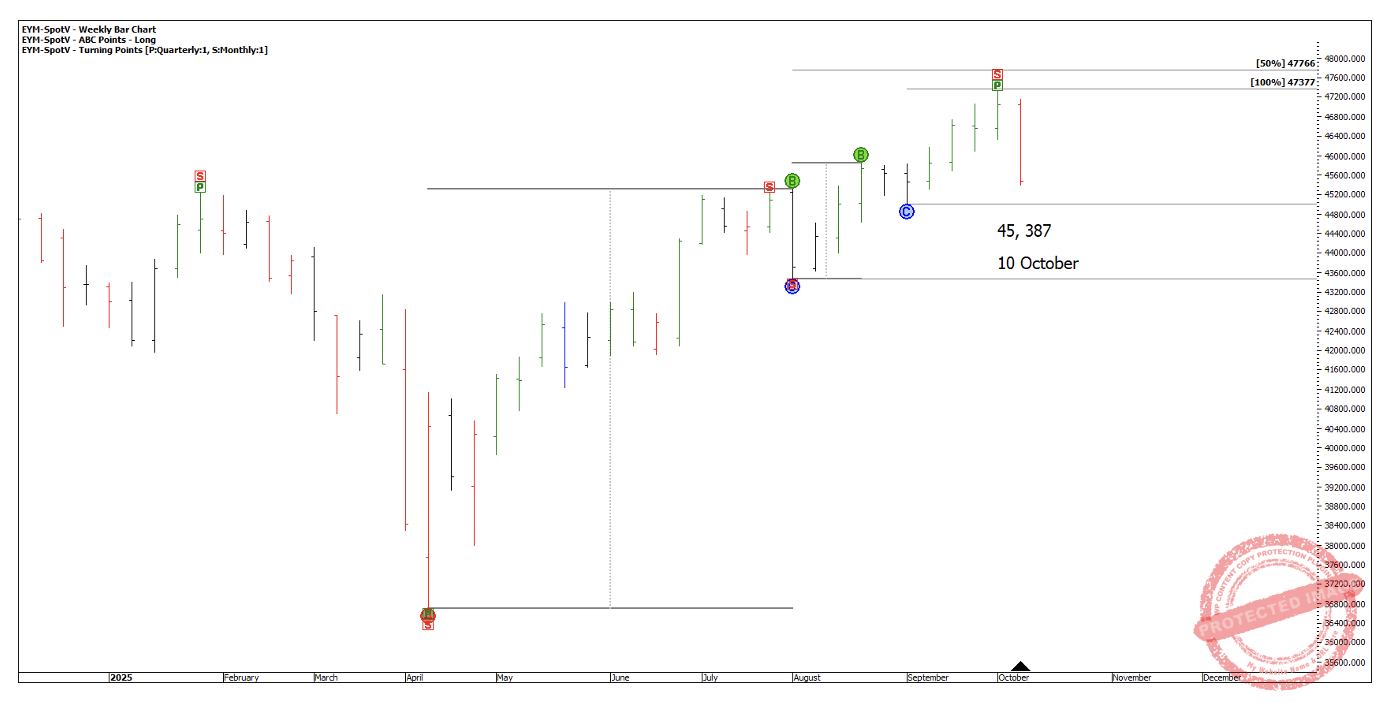
Chart 2
I’ll pick up my analysis from that point and continue as my search for a weekly Point C remains!
The 2 September weekly swing low at exactly 45,000 found support on old all-time highs. However, the weekly swing retracement was caused by an outside week and was only about 33%.
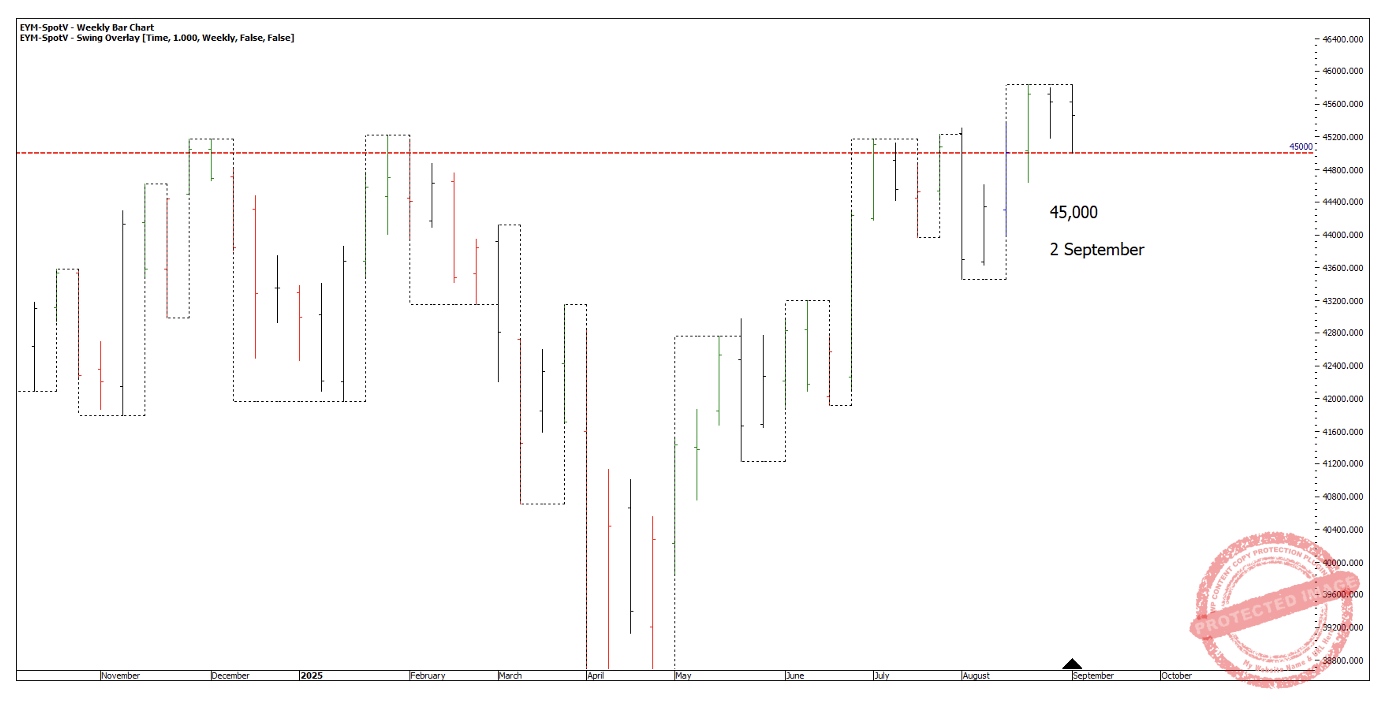
Chart 3
The market then pushed higher and just failed to hit the cluster I had identified then put in a strong week down into a 10 October low of 45,387.
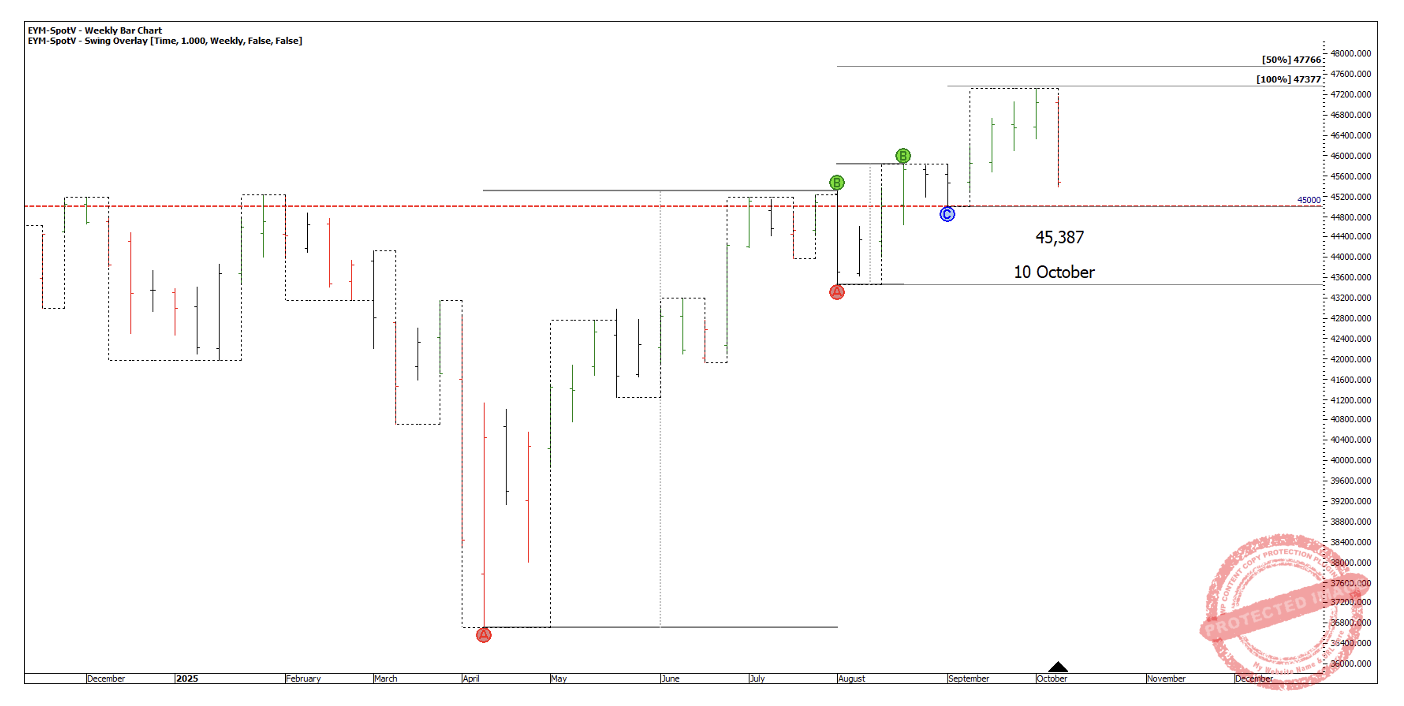
Chart 4
If you put a ranges resistance over that whole range, you can see the 10 October weekly swing low found support on the 50% retracement. This is a more balanced retracement level than 33% and a better place to trade out of in my opinion.
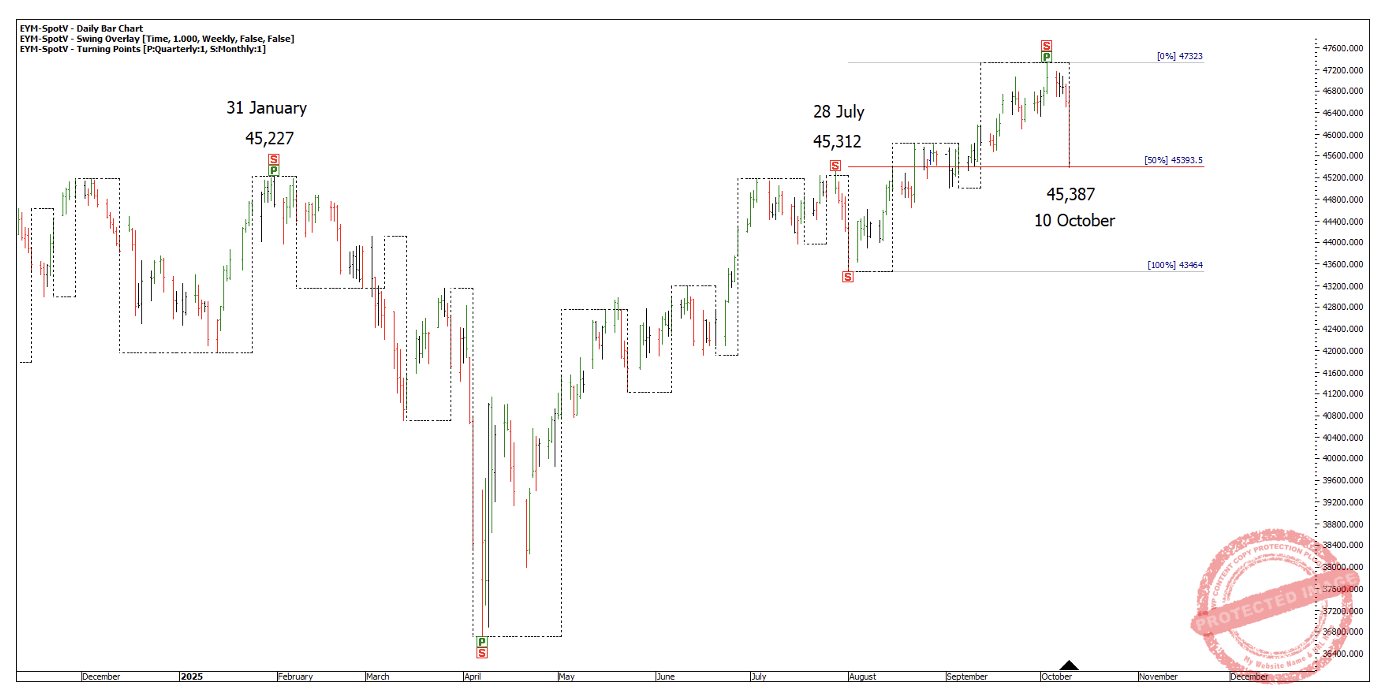
Chart 5
The Dow pushed higher only to find some resistance at the current price milestones and now shows a Point C low on 4 November at 46,976. For a stronger Point C, I would have liked to have seen Point B a bit higher so Point C could show a balanced 50% retracement on top of those milestones and finding them as clear support.
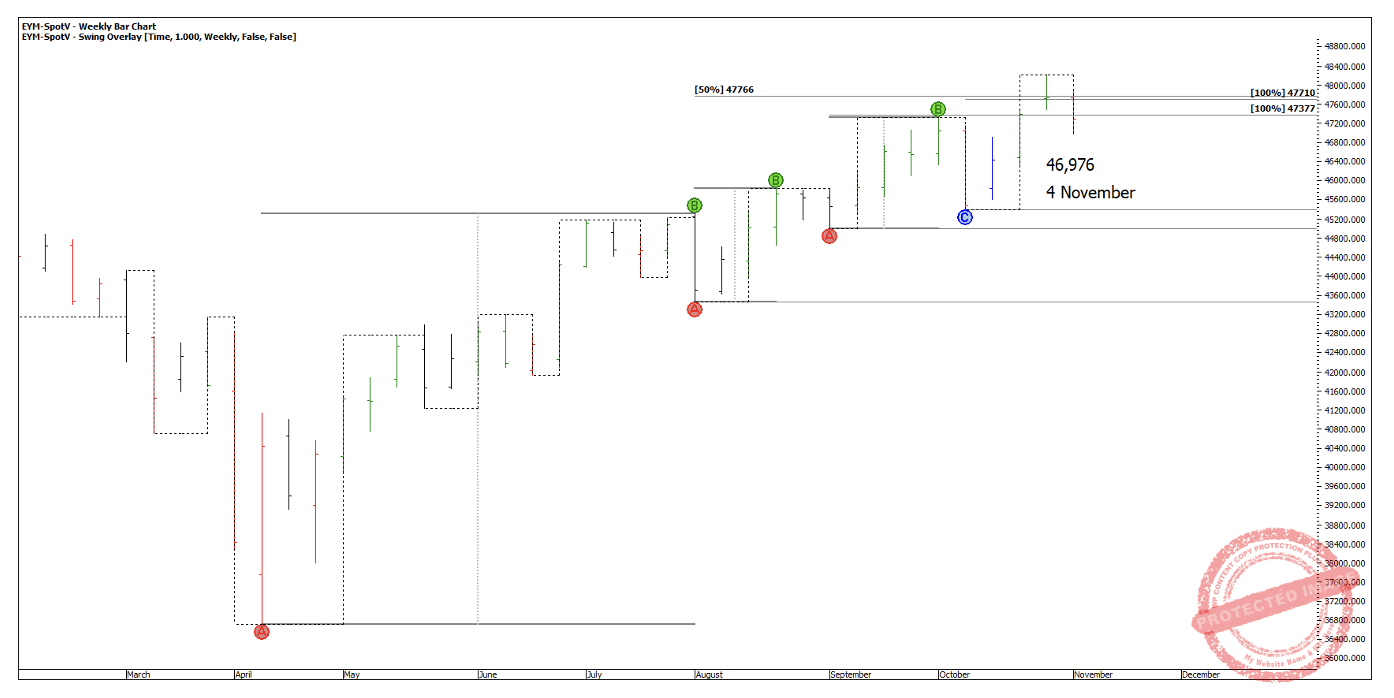
Chart 6
Dropping down to a daily bar chart, we do however see two daily swings down, but I wouldn’t be surprised to see either a third daily swing down or potentially a failed swing down into a higher swing bottom.
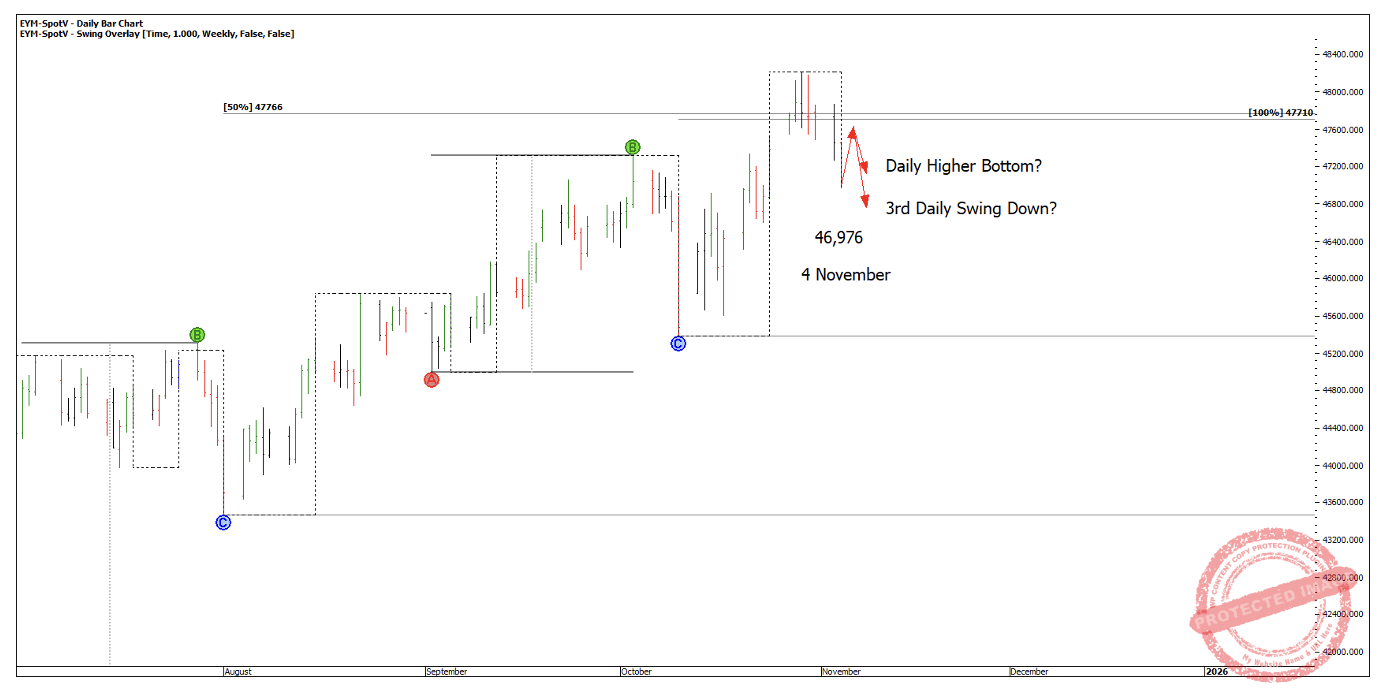
Chart 7
The potential for a trade may still be there. If you can dissect this last daily swing down using a 4-hour swing chart and use this time frame for an entry, this could be a place to look to get long providing you get a small risk which can allow you to move stops to break even quickly to cover risk.
Through my analysis, my gut feel is that this market is going to push higher but I am always wary of the shallow weekly swing retracement. Looking at the run up since April, look what happens after a 25% – 33% weekly swing pull back. The weekly swing normally gives you another chance to enter.
So even though I think the trend will remain up, it doesn’t necessarily mean it will be a strong trend with big ranges. It might do big ranges, but it could also just take its time. At this point, the Dow continues to make weekly higher tops and higher bottoms into all-time highs, so all my trading for this market will be to the long side until there is a definite change of trend!
Happy Trading
Gus