Trending Markets
Trending markets are the backbone of any directional trading system. The ideal environment is one that delivers constant movement, in any direction at all times. We know that this is a pipe dream and that we are faced with the challenge of being able to cover enough markets to offer up the number of opportunities required to deliver on our trading goals.
The month of September can often deliver opportunity, as it is one of the main seasonal times that Gann discusses. Added to this, there is no shortage of geopolitical and major global events that can tilt markets. This we all understand, however, our goal as traders is to hold and wait for the changes in trend and jump into trending markets when they present themselves.
The markets I closely follow have offered up good conditions in 2024, and we saw in last month’s articles that outliers like the French CAC40 index can offer up trades with basic setups. In general terms I am starting to see several majors running into major support/resistance areas, so we could be seeing markets ready for a decision point on what the medium-term trends look like.
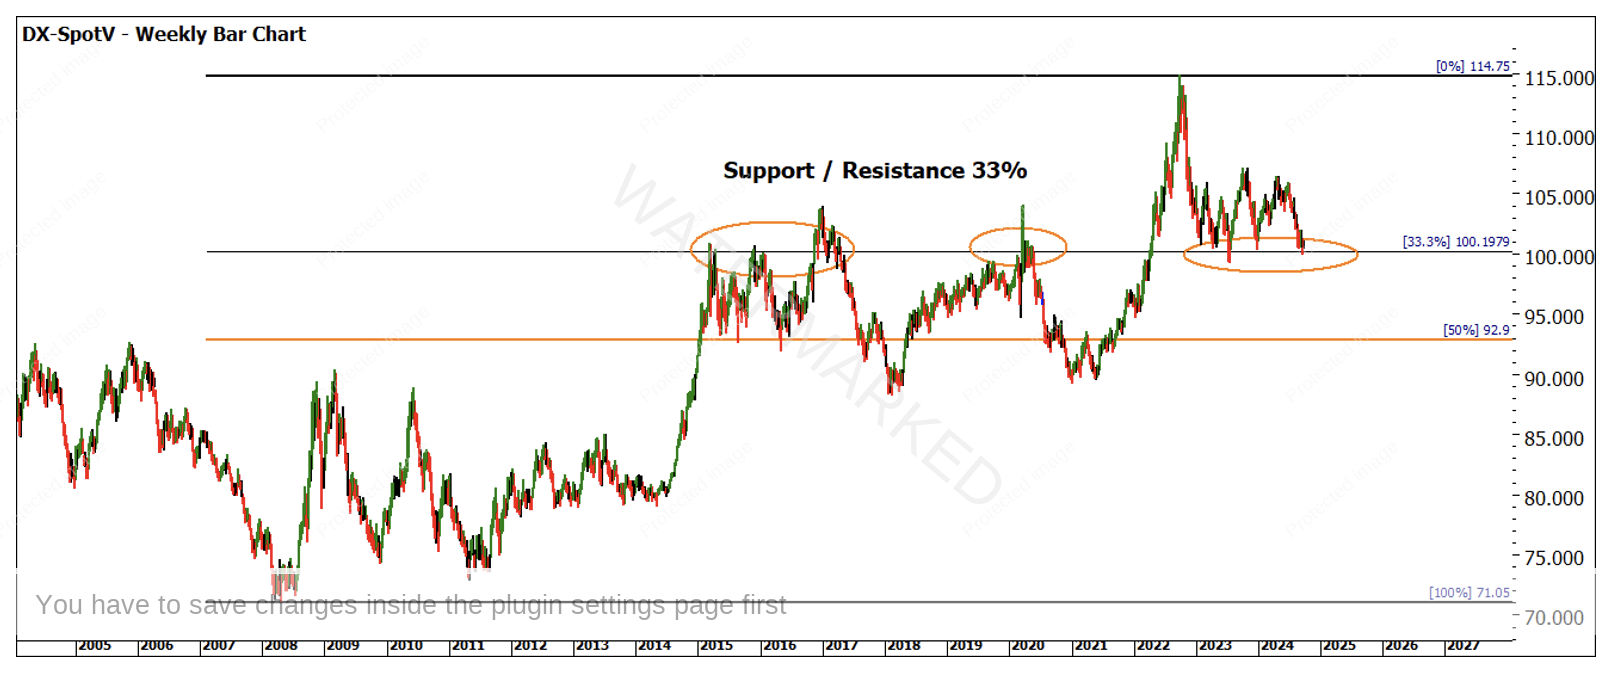
Chart 1 shows us the US Dollar Index, a major market when it comes to pricing of so many asset classes globally. The GFC low of 2008 has been followed by a 15-year bull market. It’s important to note that there is a 33% retracement level that has acted as support and resistance, and we can see a broadly sideways pattern that could again act as a place to watch for a market response.
Chart 1 – DX-SpotV Weekly Bar Chart
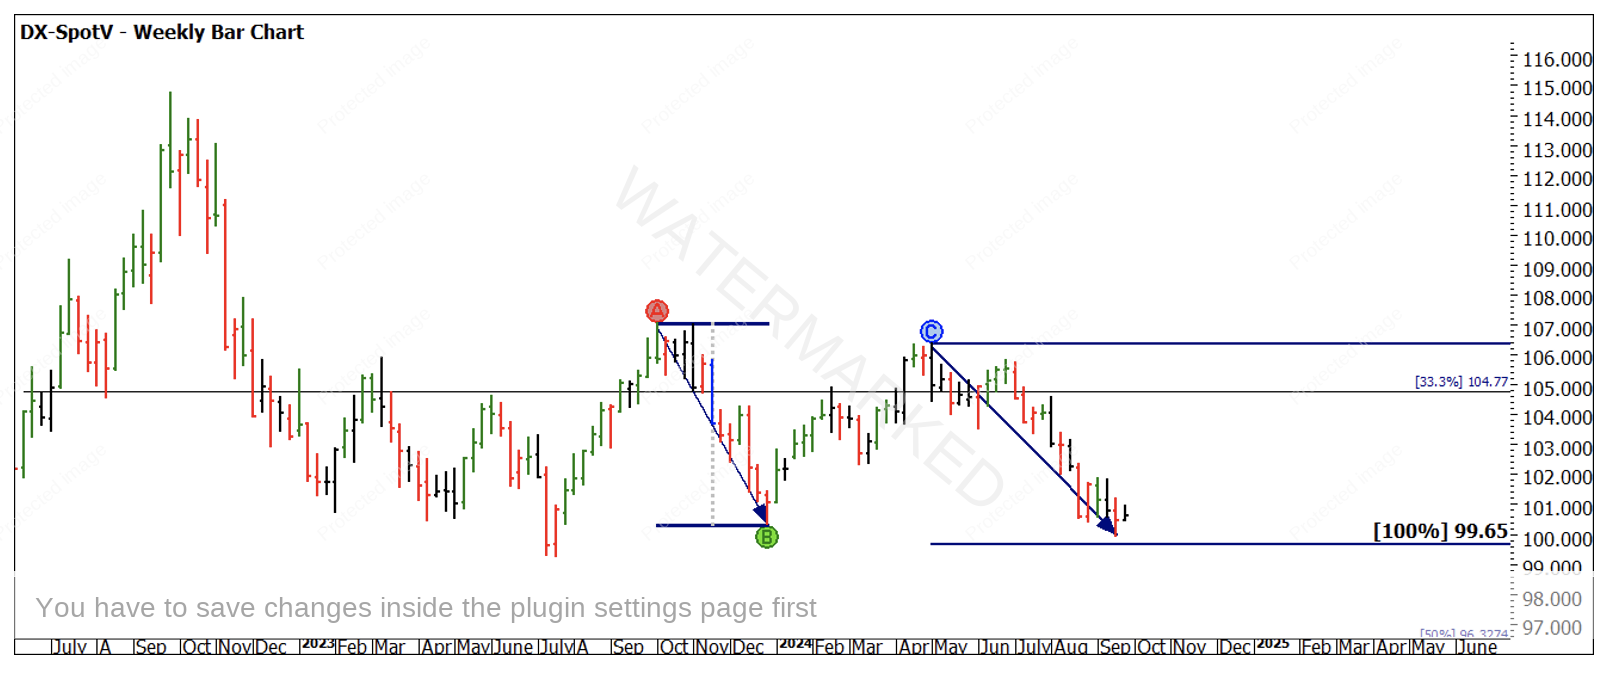
Chart 2 gives us more to consider as we zoom into the last 2 years from the 2022 cycle high. The point to note here is that we have seen a close to 100% repeat of price, from B to C. The time that it has taken to run the same distance in price is close to twice the amount of the A to B move. This would generally suggest that the momentum is weaker to the downside.
Chart 2 – DX-SpotV Weekly Bar Chart
We are always measuring the movements in 1st, 2nd and 3rd dimensions so we can understand how they are placed in terms of repetition.
We know the impact that energy prices have on an economy and the overall economic well-being of its citizens. Given that most of the world’s trade is in carbon-based fuels and the subsequent generation of energy for consumer use is based around US dollar pricing, we need to have an awareness of how pattern and position can impact other markets.
The US Dollar is often called by its detractors the Petro Dollar so looking at the Crude Oil market the position of its pricing and how it correlates with the US Dollar can be helpful.
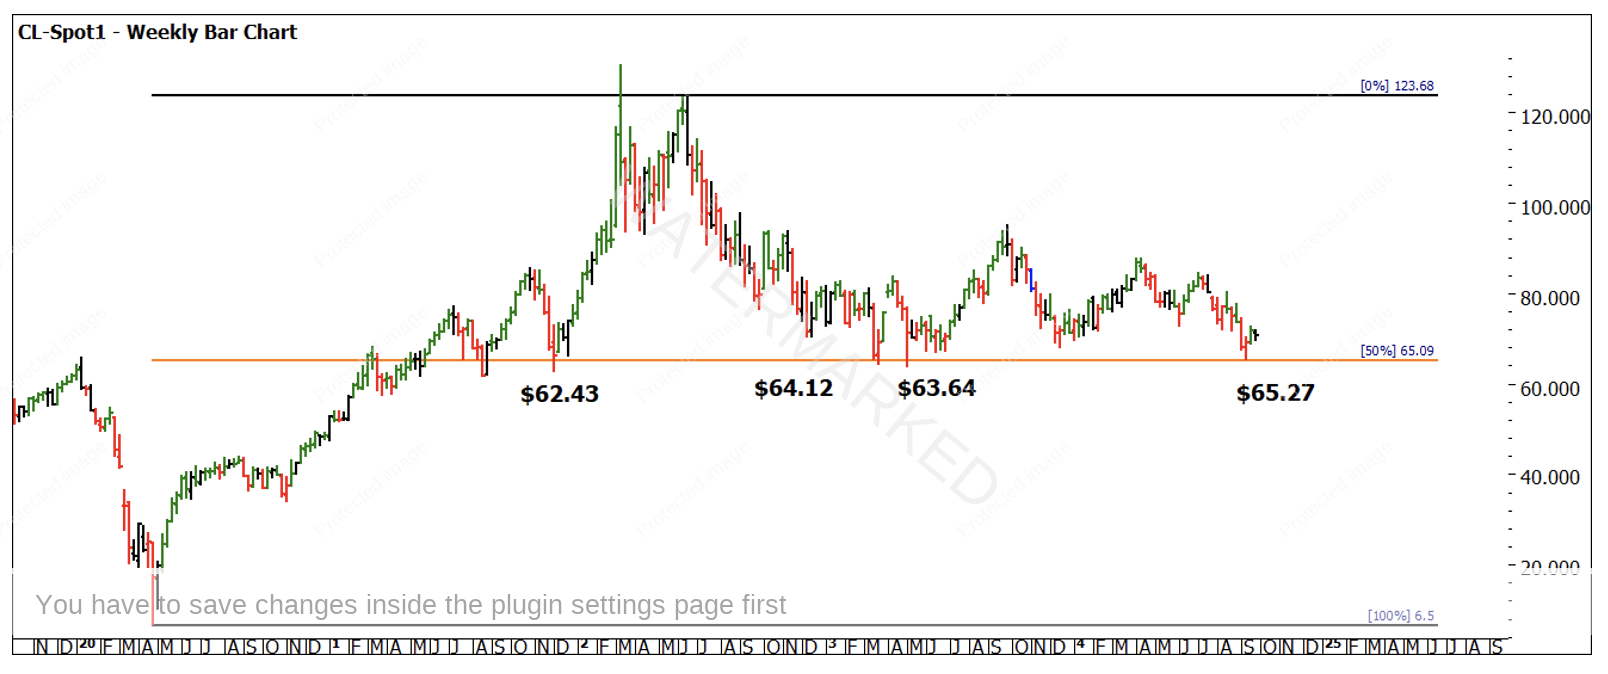
Chart 3 shows the Crude market and the recent low at just above the 50% level of the 2020-2022 range $65.09. A simple strategy suggests if that level holds, the plan of trading with trends to the long side makes more sense, a break of that level suggests short trades can be in order.
Chart 3 – CL-Spot1 Weekly Bar Chart
Markets can lose their clear trends as they reach decision or turning points, the aim for us is to establish these areas in advance and wait for confirmation.
As we move forward into the months of October and November, I am reminded of the volatility that October can bring in terms of market tops and that November brings the US elections, which could offer lots of food for thought in terms of what’s next. We have seen the US Federal Reserve cut rates in the US and our own Reserve Bank hold rates in September. The inflation picture is unclear, and all these variables directly impact currency values and this folds into commodity prices.
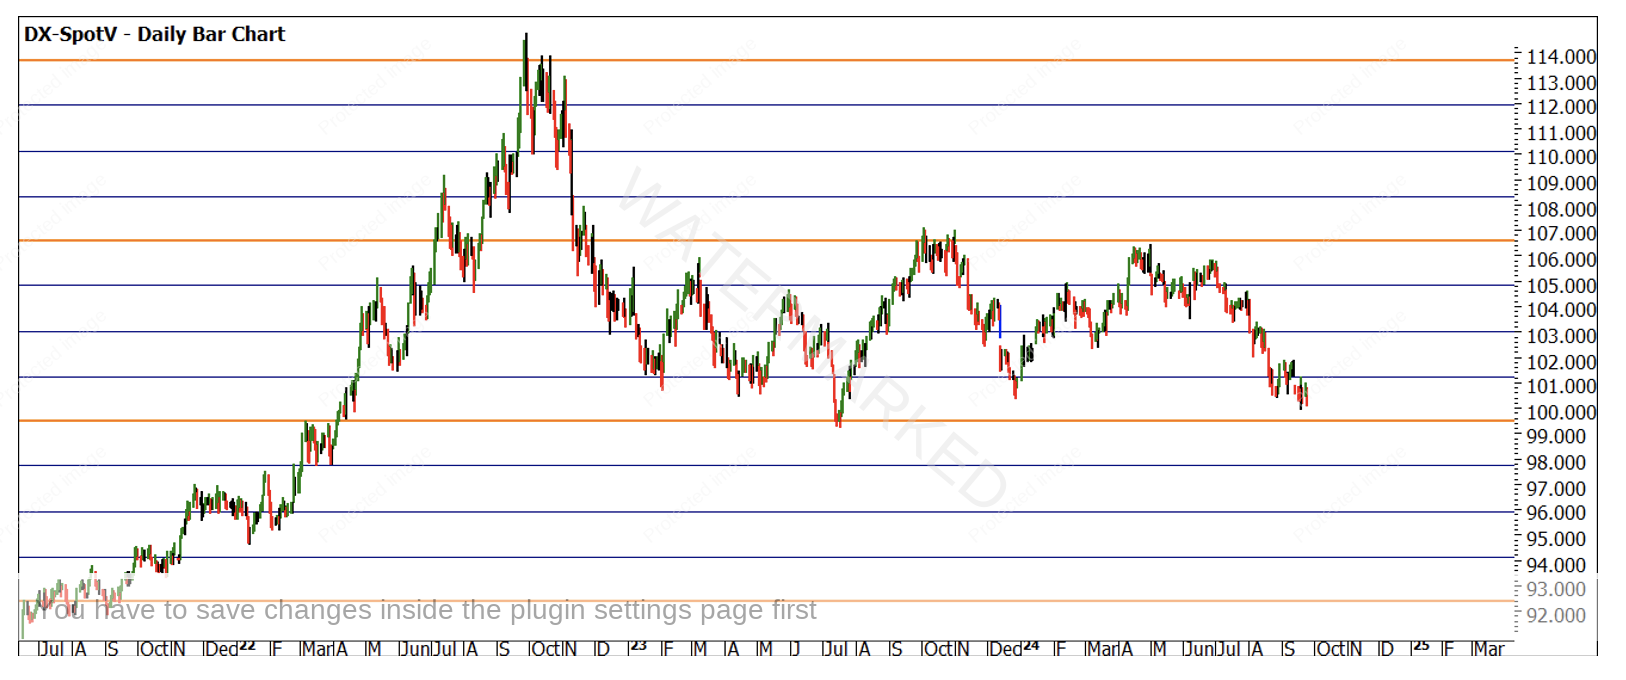
If you are looking for a band or window of US Dollar pricing, for me there is no better chart than Chart 4. Using a Lows Resistance Card from the 2008 GFC low (major cyclical anchor) at 71.05, we can see multiples of that low in orange and the 25%, 50% and 75% levels in blue.
Chart 4 – DX-SpotV Weekly Bar Chart
The band of more sideways price action is clearly between 2 orange lines, these would be important markers when looking for a setup. If they can be used as starting points of a trend, they can add probability to the smaller picture setup you may be watching. Often the work you do in setting up a market at the start of your analysis can allow you to wait for confirmation and then set your trades accordingly.
I am expecting there is more to play out in 2024 and into 2025, the more we can be prepared for on the bigger picture, the better placed we are to react to the opportunities.
Good Trading
Aaron Lynch


