TSLA Series – The Season Trend
Let’s start the year reviewing what Tesla has been up to…
Welcome to the new year and new decade at Safety in the Market. By the time you have received this article we will have almost finished off January, with only another 11 months to go in 2020. This comment wasn’t meant to get you into gear; that’s your job, but it is important to remind yourself of the opportunities present and what is to come.
As mentioned last month, 2020 could shape up to be a very opportunistic year with plenty of markets to take advantage of, and it is our duty to provide concepts to further your education.
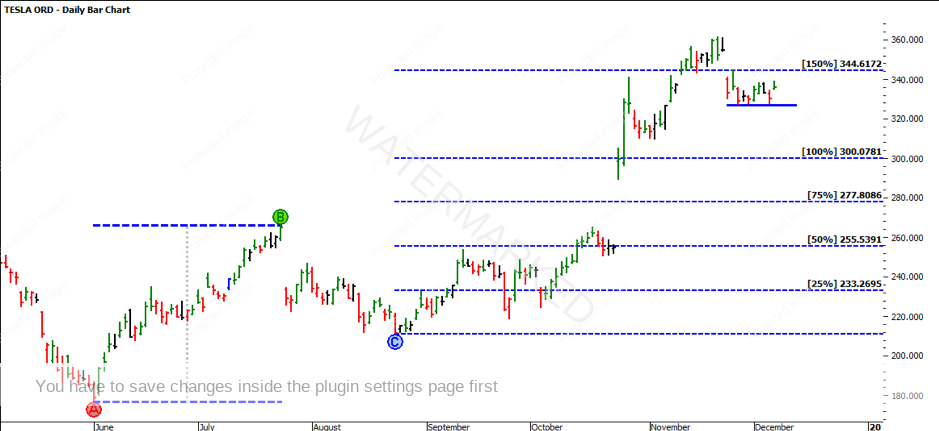
I closed 2019 with an article titled the ‘Yearly End’ which was the yearly end for sure, but was far from the end of the bull run on Tesla (ProfitSource Code: TSLA). If you take the time to review the December 2019 Safety in the Market Newsletter, you will be aware that TSLA was trading at around $340. It had just had a fairly sizable pullback and found support at $320. It was mentioned that the “pull back in the context of the full run is very minor and given we do see a break of the few daily lows, there would be no surprise”. However, there sure was no time wasted at these lows.
At the time of writing, TSLA is currently trading at $510, with new all-time highs reaching $547.41 on 14 January 2020. When we first looked at TSLA back in July 2019, it was trading at $200. Long behold those days. For those who have taken action, you would have seen at least a 100% return on your capital by just holding the stock alone. For those who traded leveraged instruments such as CFDs, well you would have done considerably better
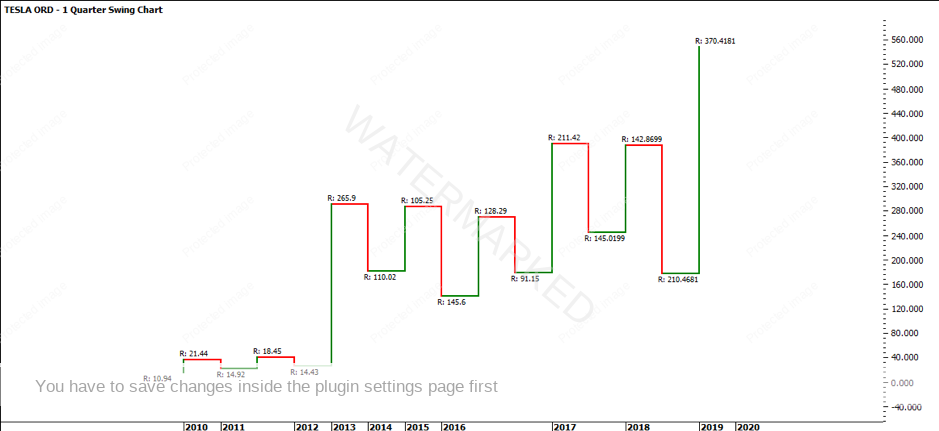
The quarterly swing chart shows it has now created a higher top. The trend is still uncertain, however in order to create an uptrend, there needs to be a higher swing bottom. The market has clearly started moving faster, so more time should be spent reviewing the smaller timeframes, especially the weekly and 2-day swing charts.
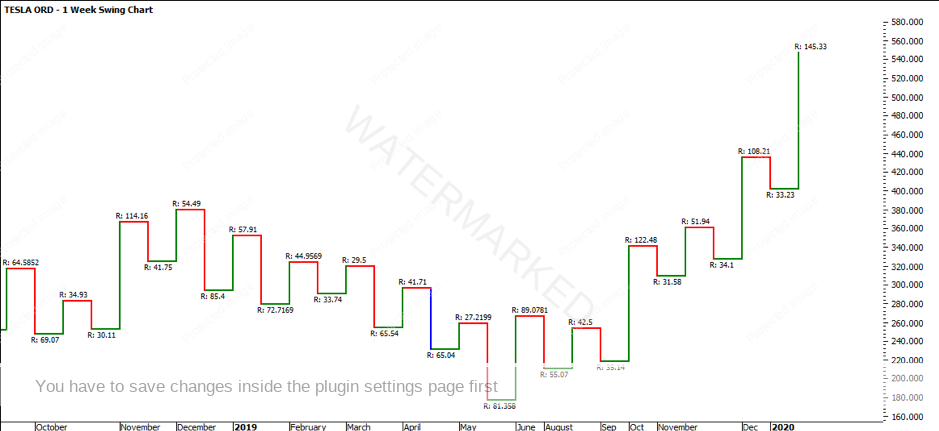
Turning to the weekly swing chart, the trend is currently up, showing higher tops and higher bottoms. The recent weekly swing up has produced a swing range of $145.33 which has exceeded the previous range of $108.21. It is also the largest range since the market started moving higher since July 2019. It is also very nice to see that the pull backs have been consistent, showing an average range of around $33.
The 2-Day Swing Chart is also very similar to the weekly chart, showing the most recent up swing to be $145.33. The 2-day swing chart however has shown a more recent pullback of $55.24 which has exceeded the previous pullback ranges. I would be happy to accept this pullback as it has not yet exceeded two consecutive days down.
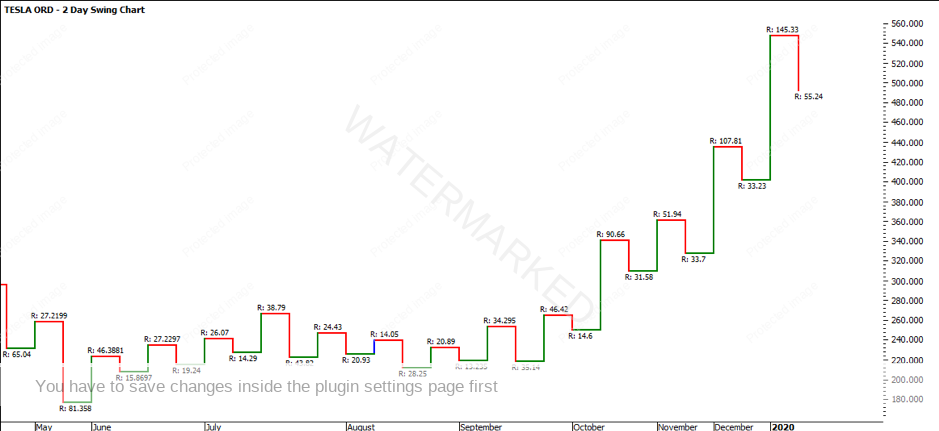
Which brings me to my next point, that when the market starts to show signs of weakness it will be worth watching how many consecutive days it pulls back. You will note that there is very little evidence of the market pulling back for more than two consecutive days since November 2019.
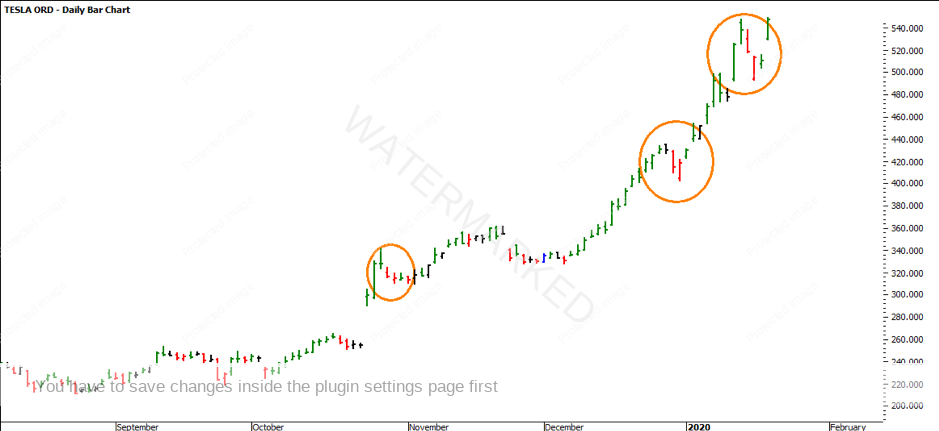
As the market continues to steam ahead it is very easy to get caught trying to pick the top. It is recommended to stay with the trend until the market offers signs that there is a pullback in play, and even when this is evident it is worth confirming that prior to jumping in and trying to short the market.
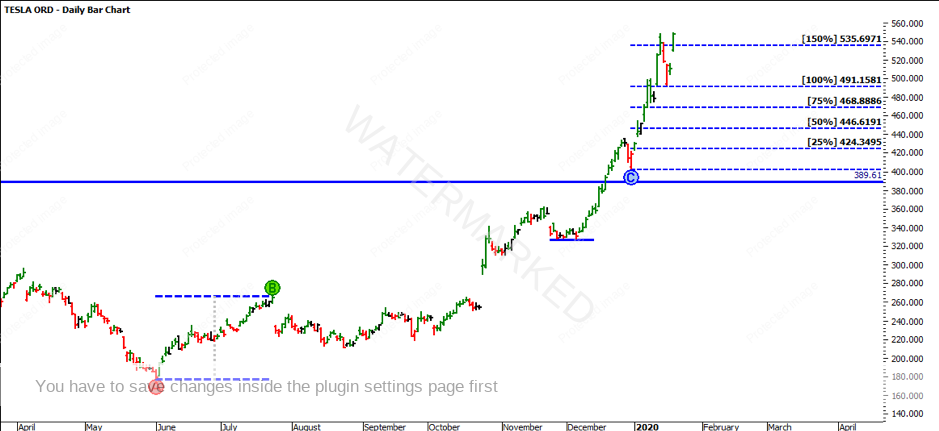
TSLA has now broken through its old all-time high, meaning that it might have plenty more run left in it. If we take the First Range Out we can see that the most recent highs come in at 150% of the FRO and 100% of the second range. What does this mean? Well it is a balanced market showing signs of harmony
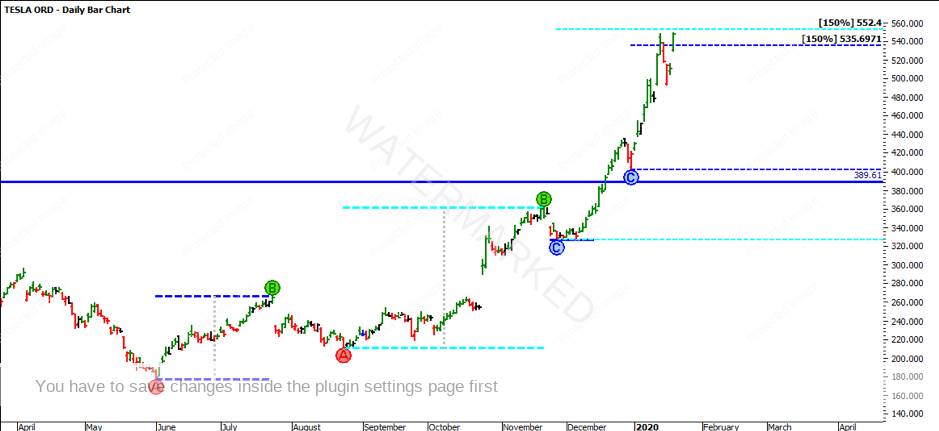
Sometimes we miss life changing runs, however the next opportunity is usually just around the corner. Although you might have missed the TSLA run, spend the time reviewing the sequences of articles from July 2019. Learn the concepts and apply them to your chosen markets, or if you don’t have a market, maybe look to stocks such as Slack Technologies (ProfitSource Code: WORK) or ANZ (ProfitSource Code: ANZ)
It’s Your Perception,
Robert Steer
