TSLA Series – Weekly Trend
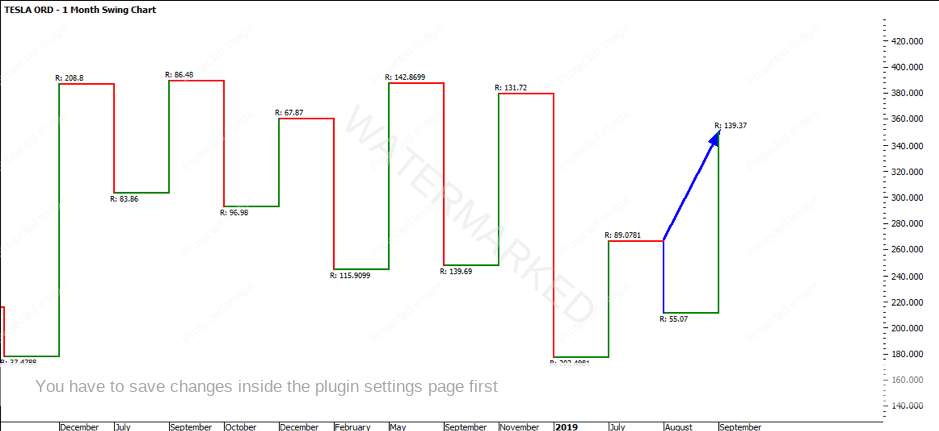
Turning to the chart below, the monthly swing chart has created a higher swing bottom. As mentioned last month, the previous monthly swing range down showed an over-extended range of $202.49. There was clearly a contraction with the following downside swing range being $55.07 which made a higher swing bottom.
We have now confirmed the higher swing top, as we have taken out the previous swing top at $266.07. The push from the bulls has seen an expansion from $89.07 to $139.37, confirming the strong upside range.
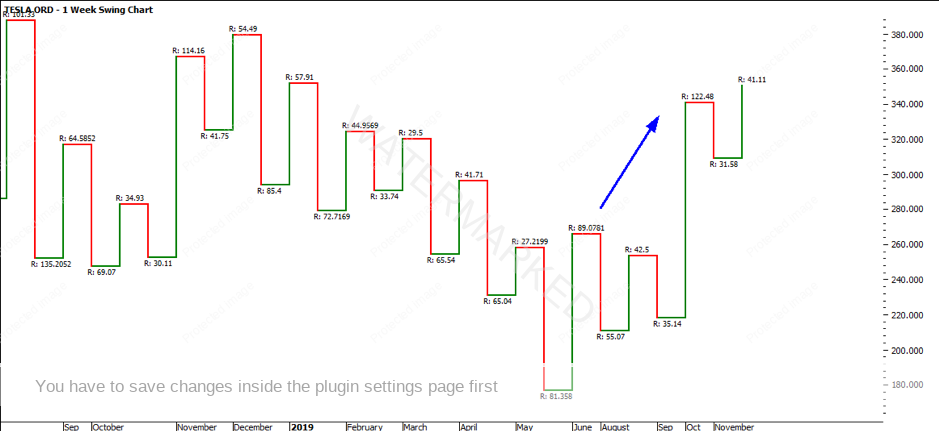
The weekly swing chart is currently UP. As mentioned in my last article, the average weekly up swing range of the last 10 up swings is $54.79. When the market first pushed out of the June low, it produced a range of $89.07, followed by a weaker range of $42.50. We can now confirm that our upswing that was in motion, produced an upswing of $122.48.
This is important to see the range exceed the average swing, in order to show strength in the move. The market also cleared out previous tops at $266. The downside weekly swings are still contracting, moving from ranges of $81 to $55 to $35 to $31.
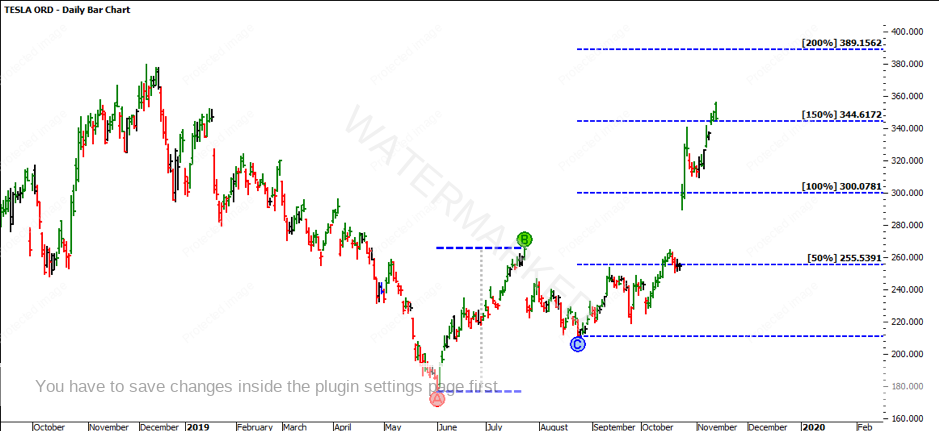
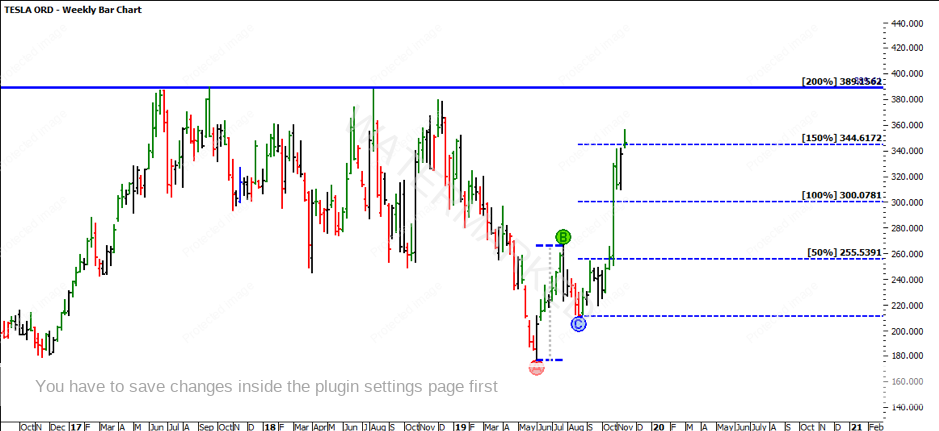
With the power in the move, supported by volume, it would be sensible to trade with the trend. The next key milestone to watch will be 200% which sits at $389.15. Interestingly the All Time High for TSLA was on the 18th of September 2017 at $389.61. There are three obvious tops at this level, and Gann said that on the fourth time the market is likely to break through.
Regardless of if the market decides to push through these levels, what is shaping up is an opportunity for a potential break into new all-time high’s or a false break out. Assuming we see a break and strong push into new highs, it is important to follow the trend as there is no resistance holding back the momentum in the market. If the false break is obvious, ultimately the market will see it was a false break and often a strong push will happen in the opposite direction.
As we are coming into the Christmas season, be sure to continue your trading discipline as the market doesn’t wait for anyone. Plan your trade and trade your plan.
It’s Your Perception
Robert Steer