Support
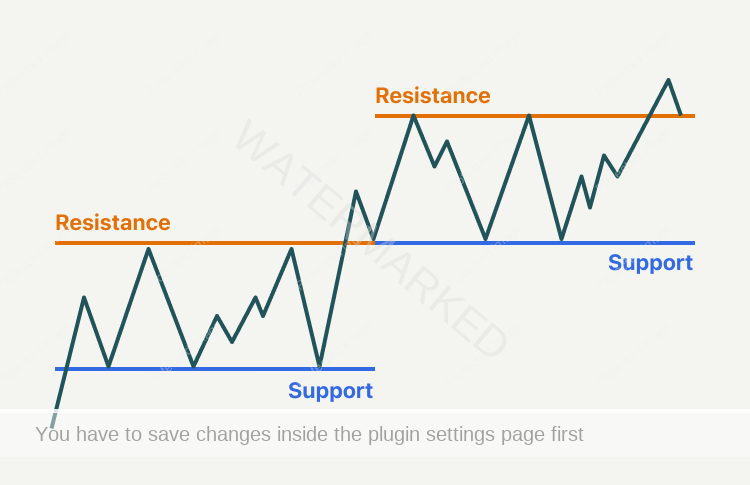
Support is a price level where buying is strong enough to interrupt or reverse a downtrend. Support is represented on a chart by a horizontal or near-horizontal line connecting several bottoms. The more times a support line has ‘held’ prices from going downward, the stronger that support line is said to be.
Resistance
Resistance is the exact opposite and is a price level where selling is strong enough to interrupt or reverse an up-trend. Resistance is indicated on a chart by a horizontal or near-horizontal line connecting several tops. If you look at your chart you’ll often see occasions where a market moves up to a certain price, falls back and moves up again only to be turned back, once again, from the same price. When this happens at a particular price area we can say that the market is meeting ‘resistance’. To further illustrate this point, let’s take a look at a recent (2024) chart of QANTAS (Code ASX:QAN) – however this could be any market, and any period of time. The lines of support and resistance are very clearly visible, and the market is currently oscillating between these two points, and has been since 2020. The price of around $4.20 is proving to be a strong point of support in the market, with the market hitting, or pulling up just shy of this point 6 times since 2020. Similarly, the price of $6.90 is proving to be a point of resistance, with the market pausing or reversing just below this point 6 times since 2020. Taking a bigger picture look and understanding where the market currently stands in between these two points of support and resistance would help you to determine whether you would buy, sell – or do nothing, if this was your chosen market to trade.

At Safety in the Market, we’re technical traders. We read charts because markets leave clues, and the price tells a story if you know what to look for.
Being able to identify key levels of Support and Resistance is one simple example of the technical analysis skills we teach – but it’s just the beginning. The real edge comes from knowing how to read those levels, when they matter, and how to trade them with structure and control.
If you want to learn how to analyse charts properly – and more importantly, how to turn those setups into real trading opportunities – this is exactly what we teach inside our Active Trader Program.
It’s where all of our students start, and even at this foundational level, many are achieving 10 to 1 reward-to-risk returns in their trading while keeping risk tightly controlled.
👉 Find out more about our Active Trader Program here.