fbpx
In February 2018, I had the privilege of unlocking RIO’s seasonality of the trend. The real essence was around what David’s focus was at Safety in the Market, ‘Seasonal ABC Trading’. As previously mentioned, David purposely establishes our thinking from an early start, using the ABC trading methodology in the Smarter Starter Pack to build the foundation around the ‘Seasonal ABC Trade’, which in turn develops our understanding of the bigger picture or ‘Seasonality of the Trend’.

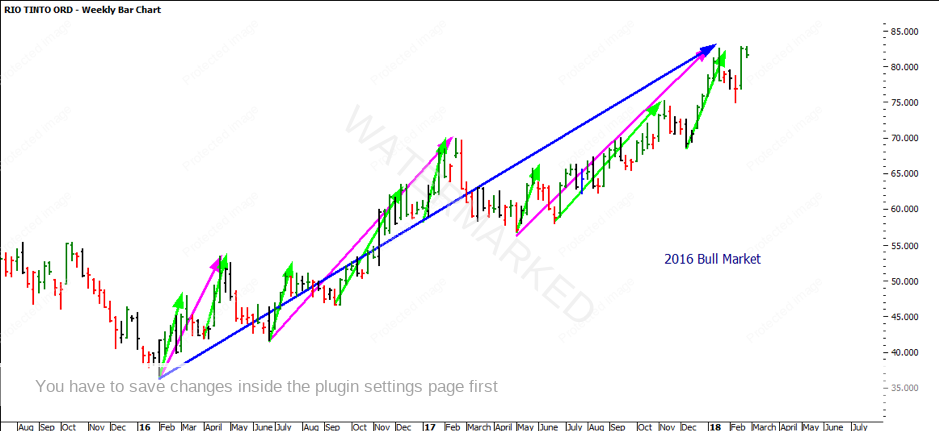
I want to pay respect to the true essence and revisit RIO to see how the seasonality of the trend played out. To recap, RIO on the Australian Stock Exchange (ASX: RIO) started its seasonal trend in February 2016 with a bull market run. I am not going to be explaining what occurred in the February article, but I do encourage you to revisit the article before commencing.

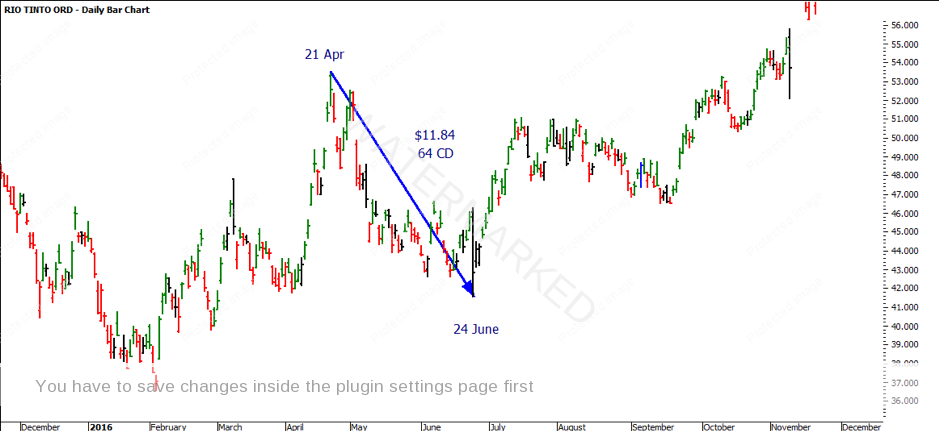
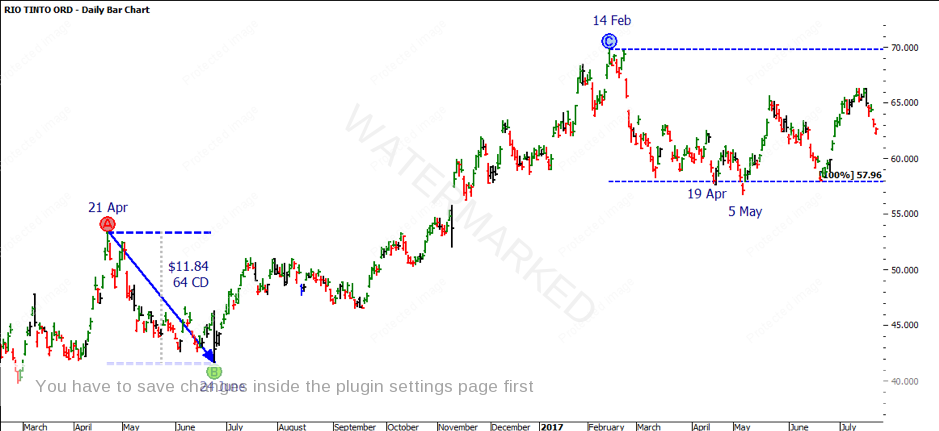
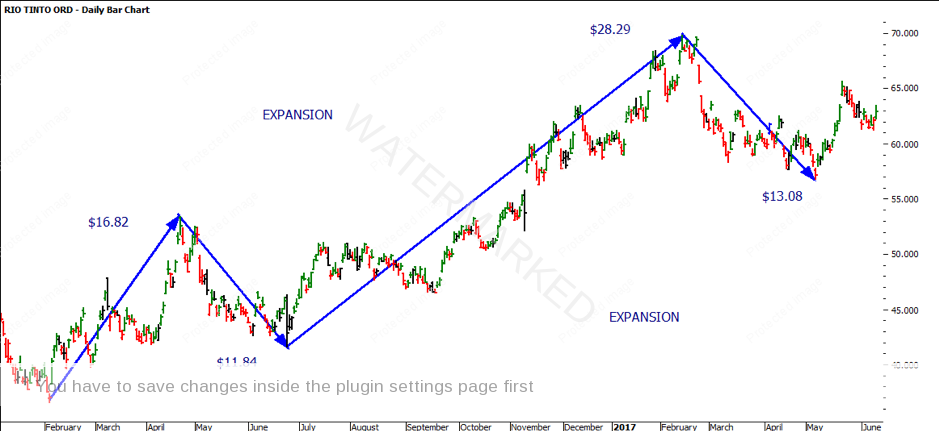
In this article, we will focus on the ‘obvious’ turning points and measure them in time and price, taking note of the repeating patterns. The key though will be around how you could monitor and measure these moves in order to execute trades with reasonable comfort.

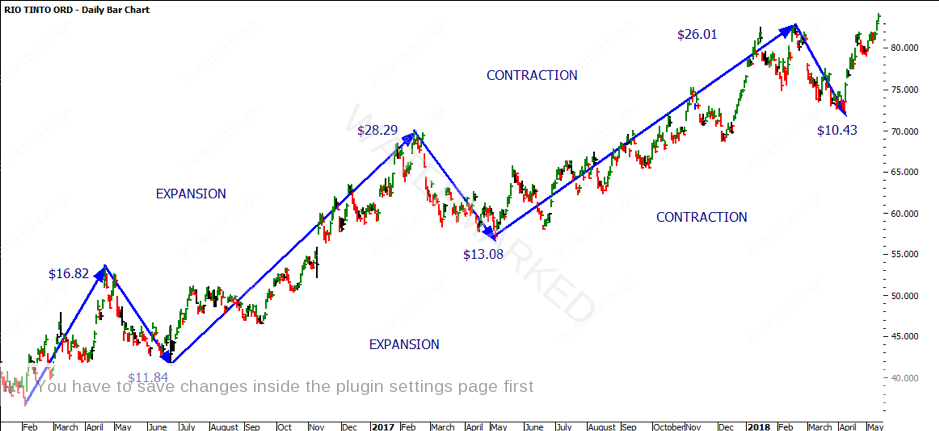
In reference to the February article, the chart below breaks down the ‘wheels within wheels’ approach into colours. The larger section is blue. The sections within the blue sections are pink and the sections within them are green. I often find that starting the process like this allows you to visually see what you are trying to break down. You even get a sense of similar range sizes when you copy and paste the arrows and apply it to the next low.

It is essential to start with the ‘First Range Out’ (FRO). The FRO will play a big part in Seasonal Trend Analysis. You can use the FRO to break down each sequential section and more often than not the FRO will have something in common with the top.

Just like any cyclical move you can measure the price and time action against the price and time reaction, similar to watching the expansion and contraction on the swing chart. In the February article, I didn’t write about the reaction. If we have a look into this further the top of the FRO was on the 21 April 2016. It pulled back into the 24 June 2016 low which is 64 days. The range of this pullback was $11.84.
If we take this range and project it from the top on 14 February 2017 at $69.80 we get a price target for a balanced market at $57.96. The market lowed initially a year later on 19 April at $57.63. It did, however, break this level, creating an island reversal low on 5 May at $56.72.
If we look at both these ranges the FRO had a range of $16.82. This was followed by a pullback reaction of $11.84. The second section range was $28.29, followed by a reaction of $13.08. Therefore, while there was an expansion to the upside, there was also a slight expansion to the downside. I personally see this as a balanced reaction due to the fact that the second section range up was nearly double and therefore a pullback slightly larger doesn’t bother me.
If we apply this exact same concept, close to a year later, to the top on 19 February 2018, the market only pulled back 75% compared to the first reaction. The low came in on  9 April which is 10 days earlier compared to the April date for 2017 and 2016. The third range out was smaller compared to the second section, meaning we have seen some contraction taking place, yet the third reaction was also smaller compared to the second section reaction. This would likely lead to a retest of the top of section three.
As the market played out, the 19 February top was taken out with the new top on 17 May 2018 at $87.09. The current pullback has exceeded the first reaction at $11.84. As of 15 August it has also exceeded the $13.08 pullback.
We have seen a First Lower Swing Top on both the 1 & 2 day swing charts as well as the 1 week chart, but not yet on the 3 day. The question is now that we have started to see an expansion to the downside in terms of the bigger picture, is it time for a seasonal change in trend? I encourage you to use the February article as a basis to justify whether the May 2018 top is the end of the section.

It’s Your Perception

Robert Steer


error: Alert: Content is protected !!