Using Alerts in Your Trading
Welcome to the January edition of the Platinum Newsletter. There’s definitely been a shift in momentum as some markets have put in strong moves in the first month of 2022. We’ve seen on a number of Indices a confirmed quarterly swing top, and the first quarterly swing since the 2020 COVID lows!
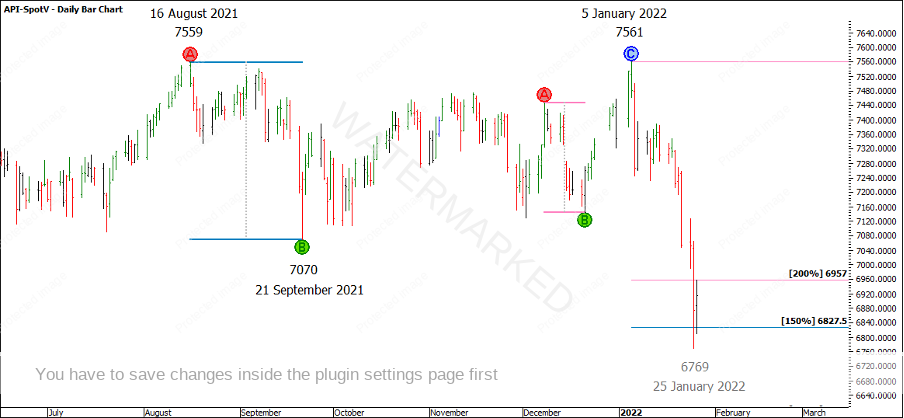
It’s worth noting though that not all Indices are in the same position. The SPI has made a strong run down from the 5 January 7561 top. This was a clear double top with the 16 August 2021 top of 7559. The move so far has been nearly 800 points down in 20 days, and the double top range has since found interim support at the 150% milestone. Looking at the previous weekly swing range, you can also see the current weekly swing has well and truly overbalanced to the down side, exceeding the 200% milestone.
Chart 1 – SPI Daily Bar Chart
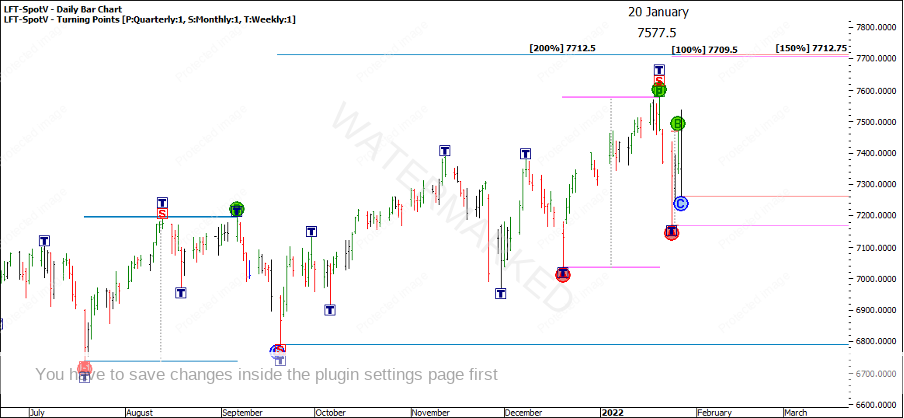
Let’s compare this to the FTSE 100, LFT-SpotV in ProfitSource. Currently showing a 20 January 2022 high at 7577.5 points, a number not too different from the SPI! What is different is the shape and its position of the market, which is still showing higher bottoms.
This is not a market I follow on a regular basis but easily enough if I run the ABC milestones over the monthly swing range, I can see a 200% milestone looming a head at 7,712.5 points. I love the 200% level and even more so when it clusters with other major milestones on other time frames.
In this case, I can see a 100% weekly swing range and 150% of a daily swing range clustering together within about 3 points. This is a great starting point for a cluster, now you can add in your other techniques to confirm whether this is a potential trading opportunity.
Chart 2 – FTSE 100 – Daily Bar Chart
I would like to see at least a few more pieces of evidence tying this cluster together on the smaller swing chart time frames. Also, can you find other pieces of evidence to call this a Classic Gann Setup?
There are no guarantees this cluster will be hit or the market will stop there if it does, but there’s no harm putting in an alert in ProfitSource to notify you if the 20 January top is taken out and to be on watch!
Alerts set in ProfitSource are a great way to stay on top of big picture clusters whilst freeing up your head space to focus on other things.
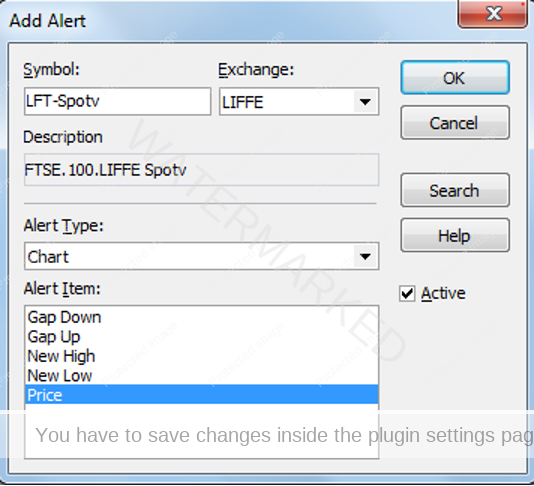
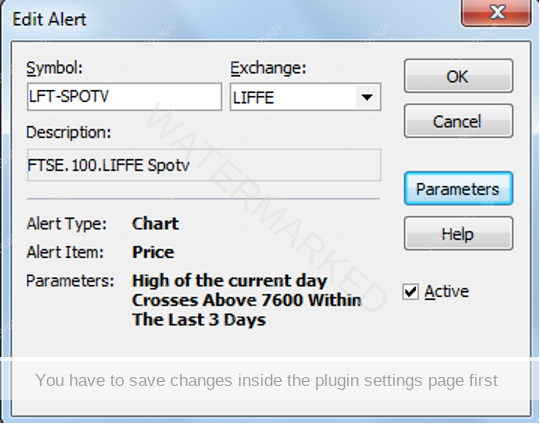
If you’re not sure how to put in an alert in ProfitSource, go to ‘Tools – Alerts’, then ‘Add new Alert’ type in the code ‘LFT-Spotv’. Under ‘Alert Type’ select ‘Chart’ then select ‘Price’ and hit ‘Ok’. It should look like the below.
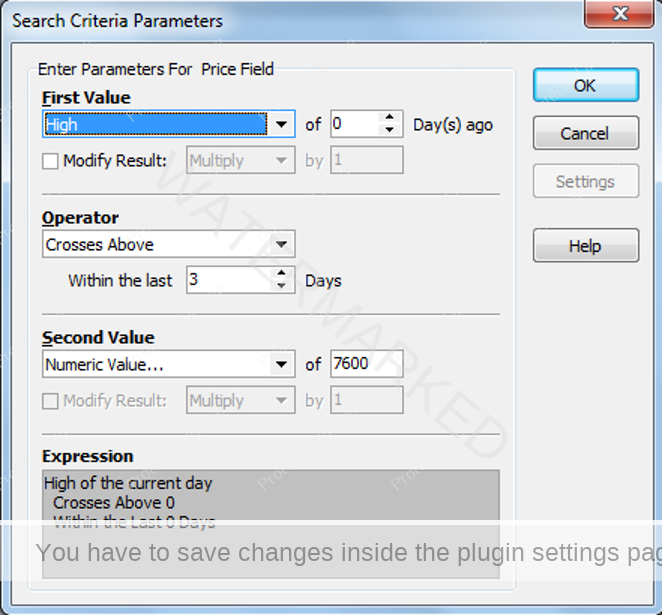
The second page will come up and it will need to look like the following.
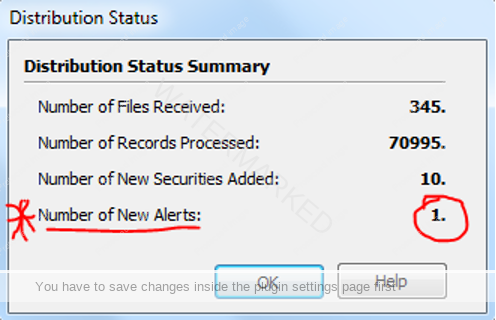
Then once you hit OK, you get a summary displayed like the below.
I’ve selected a value of 7600 points, so that when I run the Update Manager, in this case, if the FTSE has crossed above 7600 in the last three days it will show at the bottom of the ‘Distribution Status Summary’ once the update is complete. I’ve always used a value of 3 days ago in case I don’t run the Update Manager for a day or two, and for weekends.
If you hit ‘Ok’, you will be asked if you want to view the Alerts page to see which alert has been triggered.
If you missed good trading opportunities in 2021, then why not make 2022 the year to improve your process? Sometimes an alert doesn’t get hit for months and you may forget all about it. Then one day it pops up and the trade has come to you and the job has just been made a whole lot easier.
I wish everyone all the best for their trading and studying endeavours for 2022!
Happy trading
Gus Hingeley
