Waiting for the Rise
There is a common misconception that when the general market falls into a down trend that all shares follow suit. While it is often obvious to our eyes that everything is in meltdown, there are certain markets that are the ‘black swan’. It is imperative to explore the right sector by using charts, or even macroeconomic information to start your investigation.
If you run a scan on ProfitSource you’ll be able to quickly see that there are plenty of stocks still making All-Time Highs. More importantly, the result will show that there are great long opportunities to be found, even in a bear market. Often it is prudent to look for confirming factors from other styles of analysis and ensure that the move is supported by other evidence.
Gann suggested that where markets break into new highs is often a place to look for further trading opportunities. It so happens that I conducted such a scan using the ‘New Highs’ filter in ProfitSource. Gann talks about this in his Stock Market Course under the heading ‘Cross Currents’:
“You must learn to know that some stocks sometimes are declining while others are advancing and that there are cross currents, and you must know about these. Example: 1952 to 1954 Studebaker, Chrysler, Celanese declined while Vanadium, Steel, Dupont, and Aircraft stocks advanced. Only by a study of the individual stock and the different groups can you determine what stock is supposed to decline at the time when another stock is going to advance.” – Gann
At present with many global stocks making fresh highs, there are a number of markets worth stalking that are in similar positions. It is a good idea to study the sectors and the markets to make sure they are not the laggers.
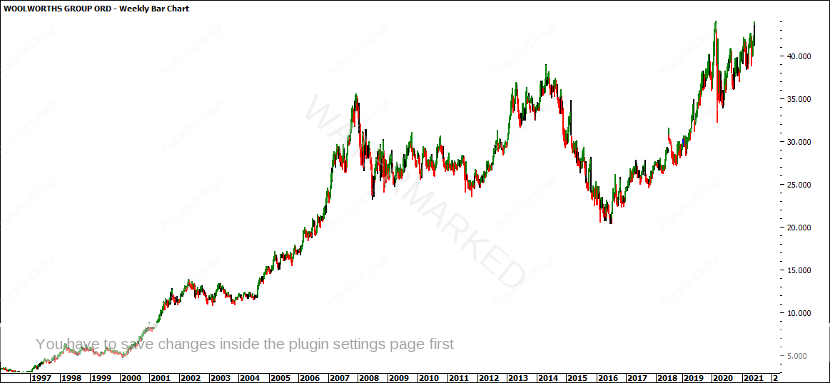
The chart below shows a weekly chart of WOW going back to 1997. As you can see in the chart, once the market experienced a break into new territory in 2020 it failed to continue to push higher. The market has since then progressively pushed higher and we can see that there could be a break into fresh highs OR a potential double top could form.
Once the market confirmed a close above the ATH, we could see the start of a new run. There are a few market characteristics that are worth looking out for. These can include 3 closes above the ATH, and an even stronger sign is a weekly close as well as a higher swing bottom above this level.
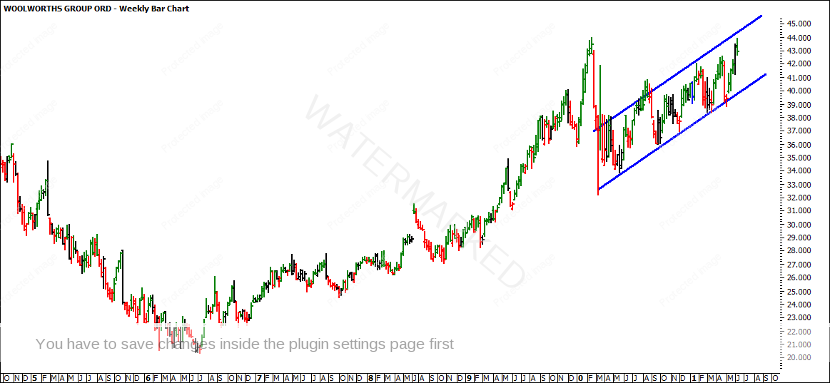
In addition, you can see there are a number of progressively higher bottoms and tops. If we run a basic trend line across these tops and bottoms, it will be safe to say that a break of these tops could be the confirmation to look for a signal long as well.
As David Bowden used to say, we need to avoid being ‘anticipatory stupid’, so rather than jumping in without a plan just to avoid the pain of missing out on the move, you should do what all great traders would do: be patient and wait for an entry based on your entry rules as taught in the Safety in the Market courses.
One approach could be to wait for the swing chart to indicate the trend is up. Once the trend is confirmed, a long trade could be taken on a daily chart by waiting for the first ABC set up.
As well as using some advanced techniques as taught at both the Number One Trading Plan and Ultimate Gann Course, an entry could be achieved at a better price using other entry strategies. This might also result in larger potential profits, but the risk can also be reduced with tighter stops.
It’s Your Perception
Robert Steer

