Watching RIO
Welcome to 2021. Sounds like a movie title that we would have watched back in the ’90s. And while a lot has changed, not much has changed either… humans! One of my favourite quotes from Jesse Livermore is:
“All through time, people have basically acted and reacted the same way in the market as a result of greed, fear, ignorance, and hope. That is why the numerical formations and patterns recur on a constant basis. Over and over, with slight variations… markets are driven by humans and human nature never changes.” Jesse Livermore
That’s a handful to swallow first up, but that is our reality. By the time you have received this article, we will have likely finished off January, with only another 11 months to go in 2021. This comment wasn’t meant to get you into gear; that’s your job, but it is to remind yourself of the opportunities present and what is to come.
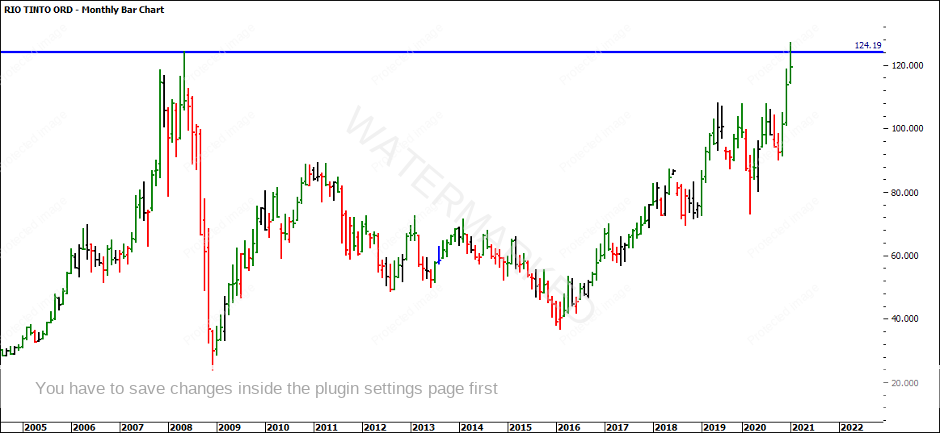
One particular opportunity that is of interest is the current Double Top at the All-Time High (ATH) on RIO TINTO (Code: RIO). The great thing about a Double Top (and Double Bottom), is that there is an opportunity to either trade the break or to short the resistance level. For example, if we see a break into fresh highs, there is an opportunity to continue with the trend as well as potentially short the Double Top. Either way, we can analyse this area as a pivotal area.
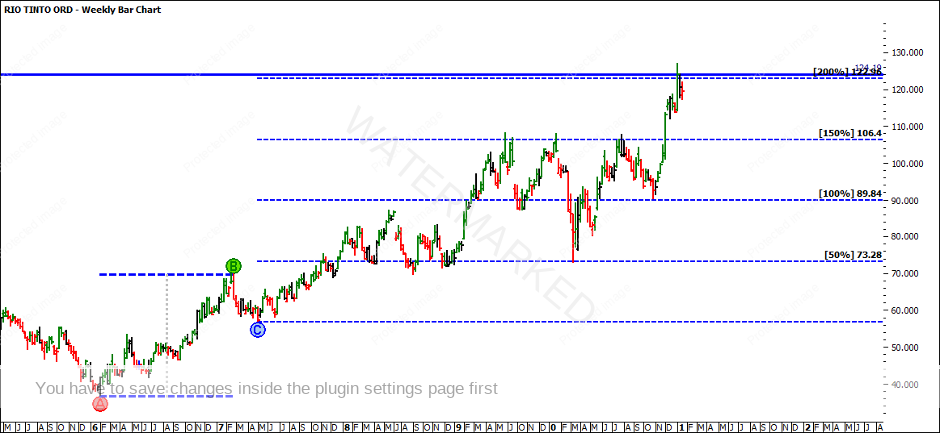
Whatever the outcome of the Double Top might be, let’s take this opportunity to analyse the run into the current tops. If we place Point A on the bottom made at $36.53 in February 2016 and Point B a year later in February 2017 at $69.80 and project this from $56.72 in May 2017, it is obvious that the market pulled up a few times at the milestones. The 50% level at $73.28 has acted as support for the market multiple times, 100% has also held the market, 150% has reacted as resistance, however, the most recent fourth time breakout allowed the market to run to 200%. The current 200% level is where the old ATH was also.
The First Range Out (FRO) gave a reference range of $33.12. This range projected from the September 2018 low at $69.41 repeated 100%. This range projected from the March 2020 low at $72.77 repeated 100% and lastly the range projected from the October 2020 low at $90.04 repeated into 100% which clusters with the 200% milestone in the previous chart.
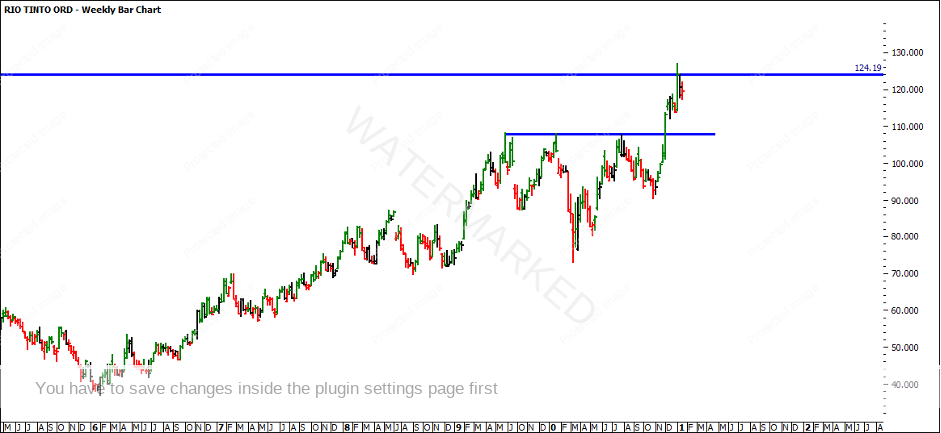
How could we have taken advantage of the most recent run up? There are a few areas which would have been areas to watch. Firstly, the obvious one is the breaking of multiple tops around the $107.80 price point. Three tops over 12 months were made. May 2019 at $107.99, January 2020 at $107.79, and July 2020 at $107.64. Given you saw these tops, it is around $16 to the previous ATH, so it would be an opportunity to trade into this level to see a re-test of this previous high at $124.19.
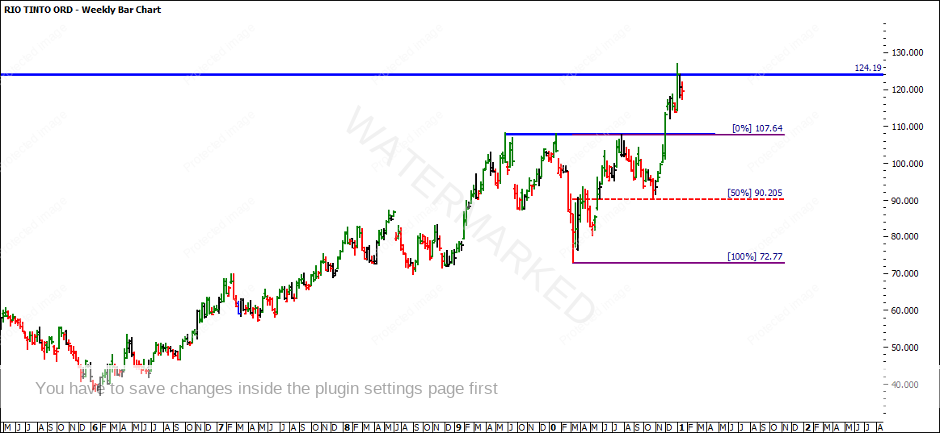
Another key area which would have allowed you to jump in slightly early was the 50% retracement and 93 days from the July 2020 high. Remember Gann and David said that you can be very profitable from the 50% retracement rule alone. The power of 50% and Time by Degrees should never be underestimated.
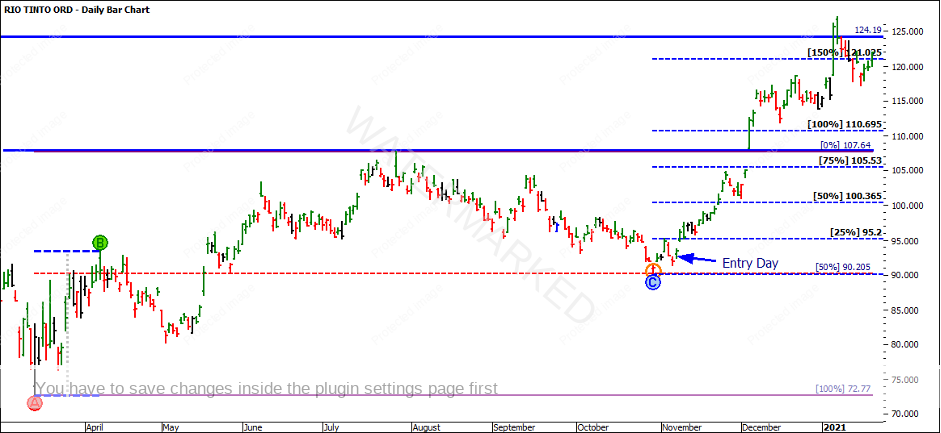
Let’s spend some time reviewing how we could have traded out of the 50% low. Turning to a daily chart, you can see that the market made a daily island reversal on the 29th of October 2020. If this entry was too aggressive, you might have liked to have waited for the First Higher Swing Bottom. Typically, when it is a Type 2 trade it is recommended to give the market some breathing room so stops would likely be placed under the 50% level.
In that case, you would have entered the market on the 6th of November 2020. One of the key questions would be, what reference range would you have used? If we take the reference range of the 1st Section out, prior to the market making its 50% retracement, this reference range is $20.66. Projecting this from the low at 50% we can allow up to 25% of the milestone to make entry. This is what the potential position size would look like:
|
Entry Stop |
$92.52 |
|
Entry Limit |
$95.20 |
|
Stop Loss |
$90.80 |
|
Risk Per CFD |
$4.40 |
|
Account Size |
$10,000 |
|
5% Account Risk |
$500 |
|
Number of CFDs |
113 CFDs |
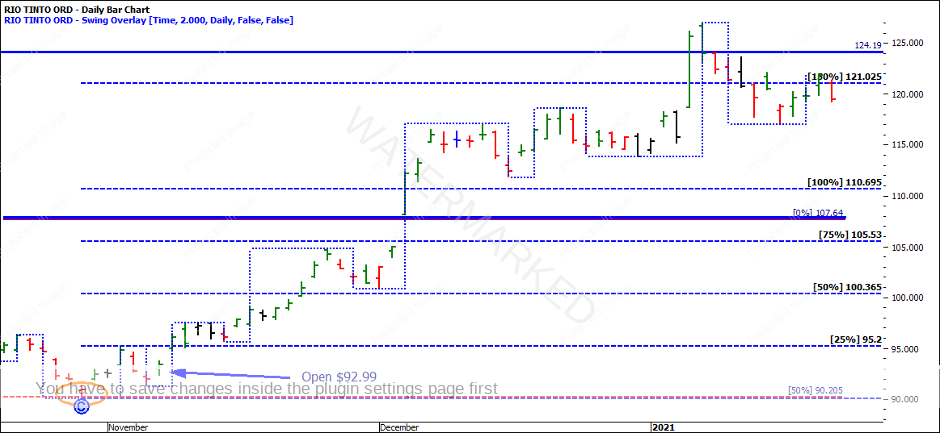
The market opened at $92.99 on the 6th of November 2020. You would have been filled on the open. As we have allowed the market some breathing room, you’d be more inclined to trade the 2-day swing chart so that volatility wouldn’t whip you out of the market. If this was the strategy, you would likely still be in the trade today. The stop would be under the 18th of January 2021 low at $117.03. With an entry at $92.99 the position size would currently be up $24.04 per CFD or in profit $2,716.52 (minus brokerage and financing costs).
Now it is your turn, what is the most profitable way to trade this setup? Do you think this strategy might assist in the opportunity to come from the ATH Double Top? Also, take the time to see how you would have traded the breakout trade on the 3rd of December 2020.
It’s Your Perception
Robert Steer
