Welcome to 2020
Let’s recap on what the SPI200 has been up to…
Happy New Year to you all, I hope the festive period was enjoyable for you and my thoughts are with all of those affected by the bush fires especially to any of those in the Safety community that were impacted. As the New Year begins, we all start to focus on our goals and desired outcomes for the year ahead. The process of setting goals is critical in my own preparation and I encourage you to be detailed and honest when making them.
The markets certainly did not fail to deliver over the break with record highs being created in the Australian and US index markets. We will focus on the SPI and ASX200 in Australia for our discussion. I can still recall the day the Australian market made its top on the SPI back in 2007 at 6880, there was a fair amount of buzz in our community at the time with many of the instructors and traders all hunting around for tops at that time. The markets started to fall well before the term GFC had been coined and there were many who thought that what became the mother of all declines was just an opportunity to add to their long positions. There is no replacement for the experience of trading through market milestones like this, as on a chart in hindsight it’s pretty straightforward. I recall waking up in Australia to see the Dow Jones had traded in a 1000-point range overnight and travelled up and down that range multiple times in one session. Textbooks can’t quite prepare you for that.
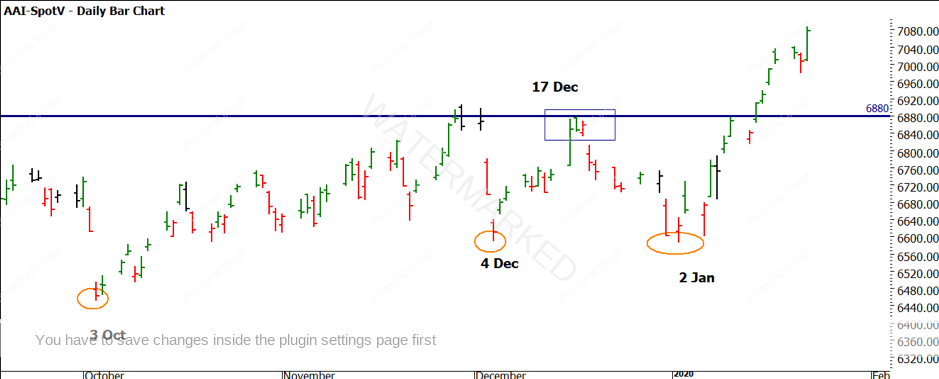
I have previously discussed the Christmas Rally period and the cycles that have a tendency to deliver over the break. In Chart 1 on the SPI200 we can see the lead up to the markets making fresh and record highs. The typical pattern in December has seen markets run hard through December into January. This was somewhat different this year as we saw the low come in on 2 January and the markets drive higher from there. Also, to note is the general timings of lows in the market in the first week of the month.
Chart 1 – Daily Bar Chart SPI200
If we look at our price-based toolbox of techniques in the Smarter Starter Pack and the Number One Trading Plan we are now more limited in the tools we can employ. Swing charts remain our first point of attack but as we make new highs, we can no longer employ a Highs or Ranges Resistance Card to assist with generating price clusters. This means we now need to lean more heavily on the use of ranges from our swing charts on multiple time frames as well as Lows Resistance Cards and our ABC Pressure Points Tool.
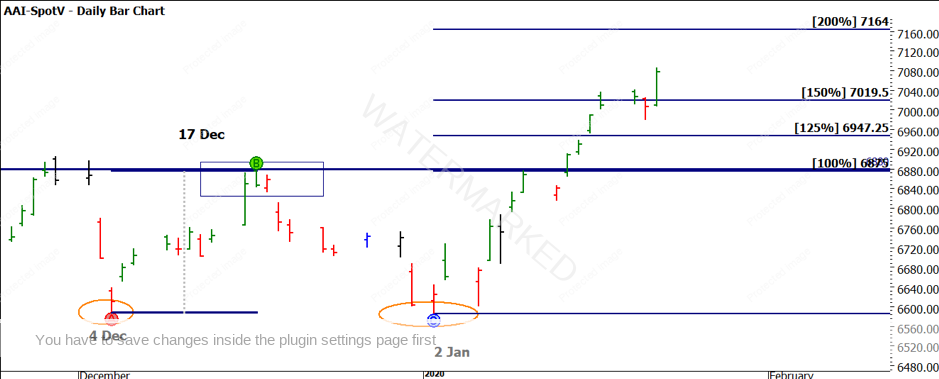
Chart 2 looks at the recent price action on the double bottom in December and January. If we project the ranges we can see the current price action is sitting above the 150% milestone and acting as support, a target of 7164 be will be interesting to watch at the 200% level.
Chart 2 – Daily Bar Chart SPI200
We can also employ the Lows Resistance Card in multiple major lows, in this instance we will stick with the all-time low from 1983. A quick reminder each of the orange lines is a full movement of 458 points, they are broken down into 25%, 50% and 75% multiples. We look for support and resistance around these lines but more importantly clusters with other techniques.
Chart 3 – Daily Bar Chart SPI200
You will see the next “orange” line takes us to a price target just above 7300, you should do the maths to define exactly that number.
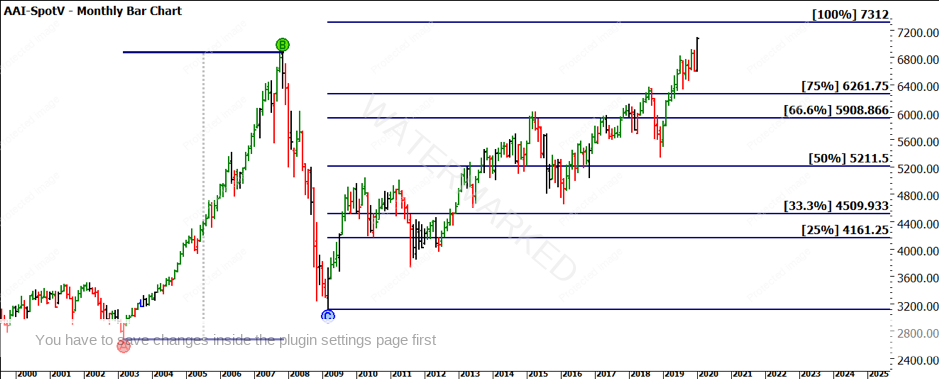
Finally, I will leave you with a bigger picture application of pressure points, using the last major bullish range of 2003 into 2008 we can see a 100% repeat of that range takes us to 7312. This could be an area that you start to look for clusters of other techniques. Once we get a top of some significance, we can apply our other tools but until then it pays to be comfortable to use the tools mentioned.

Chart 4 – Monthly Bar Chart SPI200
I trust that 2020 brings you all the trading success you desire, now is the time to start working towards those outcomes.
Good Trading,
Aaron Lynch


