What Are The Odds?
Right from the Smarter Starter Pack, David Bowden gets you looking at two very important aspects of trading where a beginner trader should start. That is:
- Looking at a mechanical trading system with very well-defined entry and exit rules; and
- Probabilities of outcomes
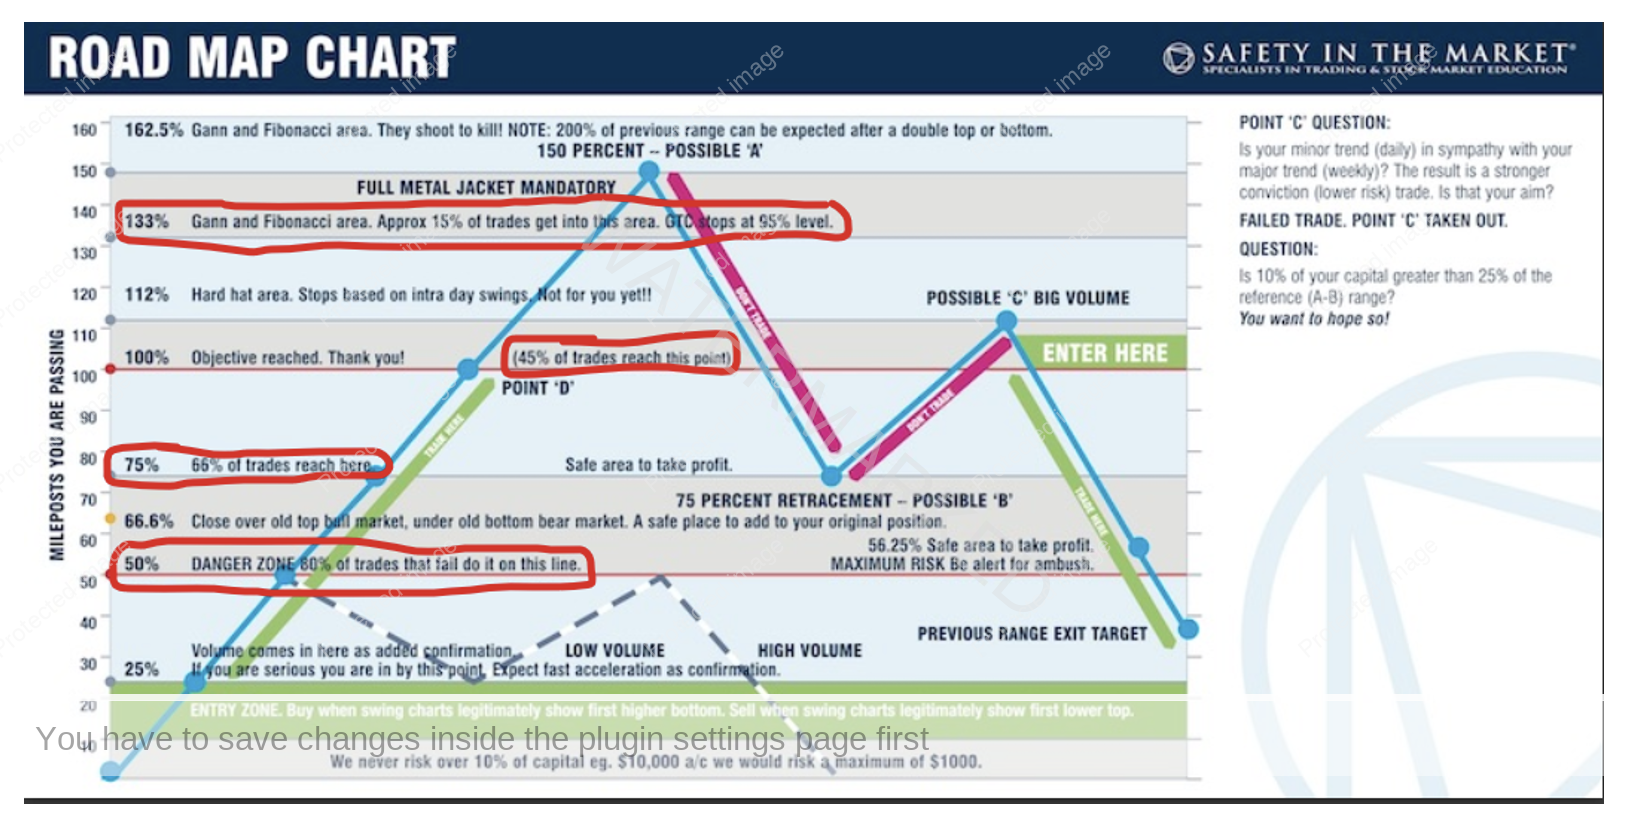
Probabilities of outcomes is right there in the Road Map Chart where certain milestones are illustrated with the percentage of trades that make it to that level.
Chart 1 – David Bowden’s Road Map Chart
In the September Platinum Article, I wrote about rating Friday’s close price as an indication of the following weeks direction on the SPI200. To recap it here, my parameters are if Friday’s close is above Friday’s open, and above Thursday’s close price, then there’s about a 65% chance the next week is an up week. The longer the market has been running down, the bigger the improvement on 65% there is.
The trading strategy is, after a strong Friday close, look for the next higher daily swing bottom or Re-test Cluster to get long out of, using an intraday entry on a 15 minute, 1 hour or 4 hour swing chart that could offer up a high Risk to Reward Ratio. Reverse for a short trade.
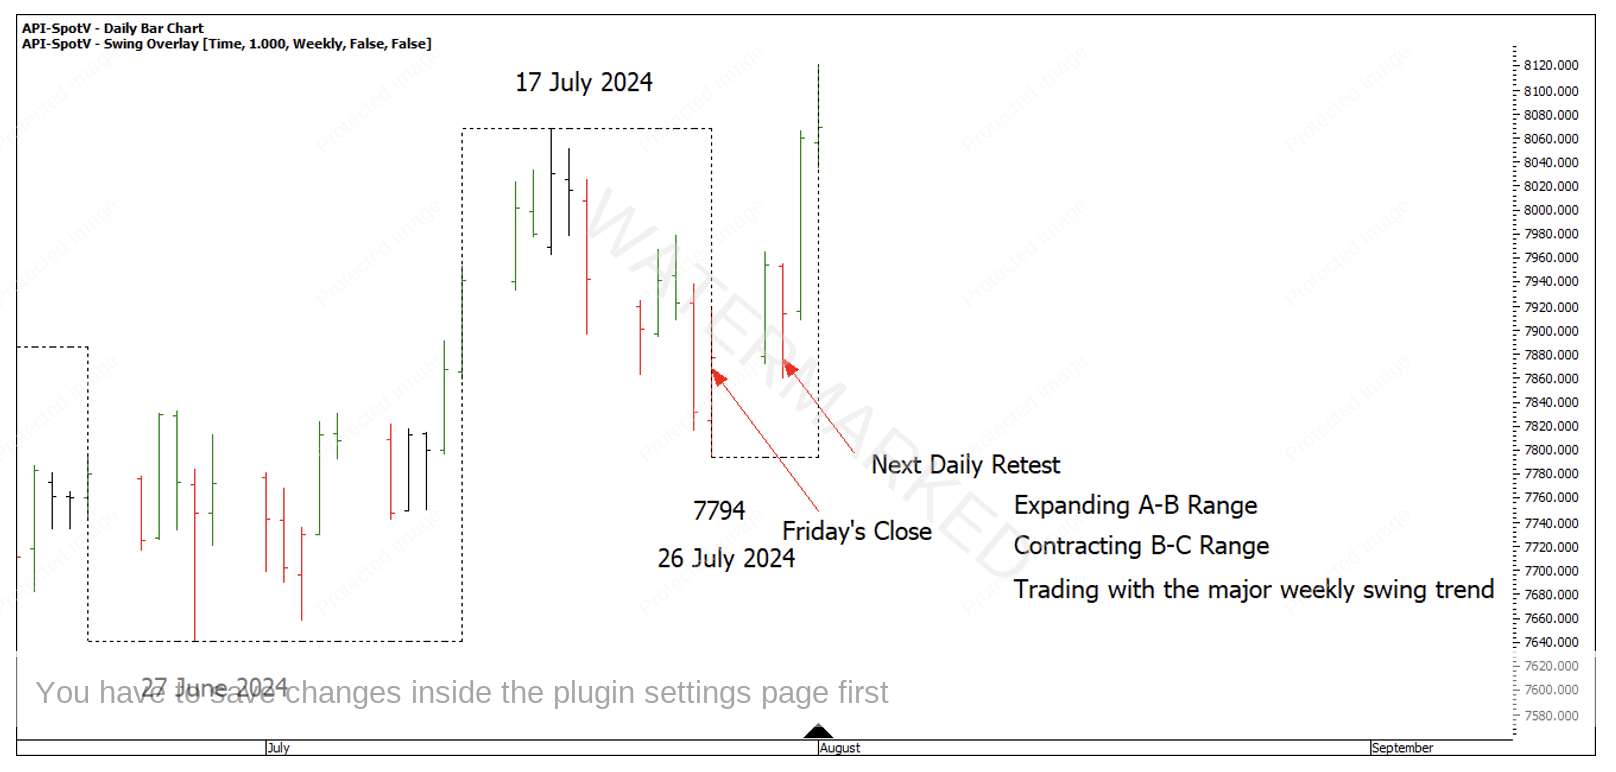
Chart 2 below shows one excellent example of this and how you could combine this with trading in sympathy with the major trend.
Chart 2 – Friday’s Close Pattern
You can easily go and test this on your own market and come up with your own statistics, in fact I encourage you to do exactly that. Could this help to formulate a mechanical trading strategy?
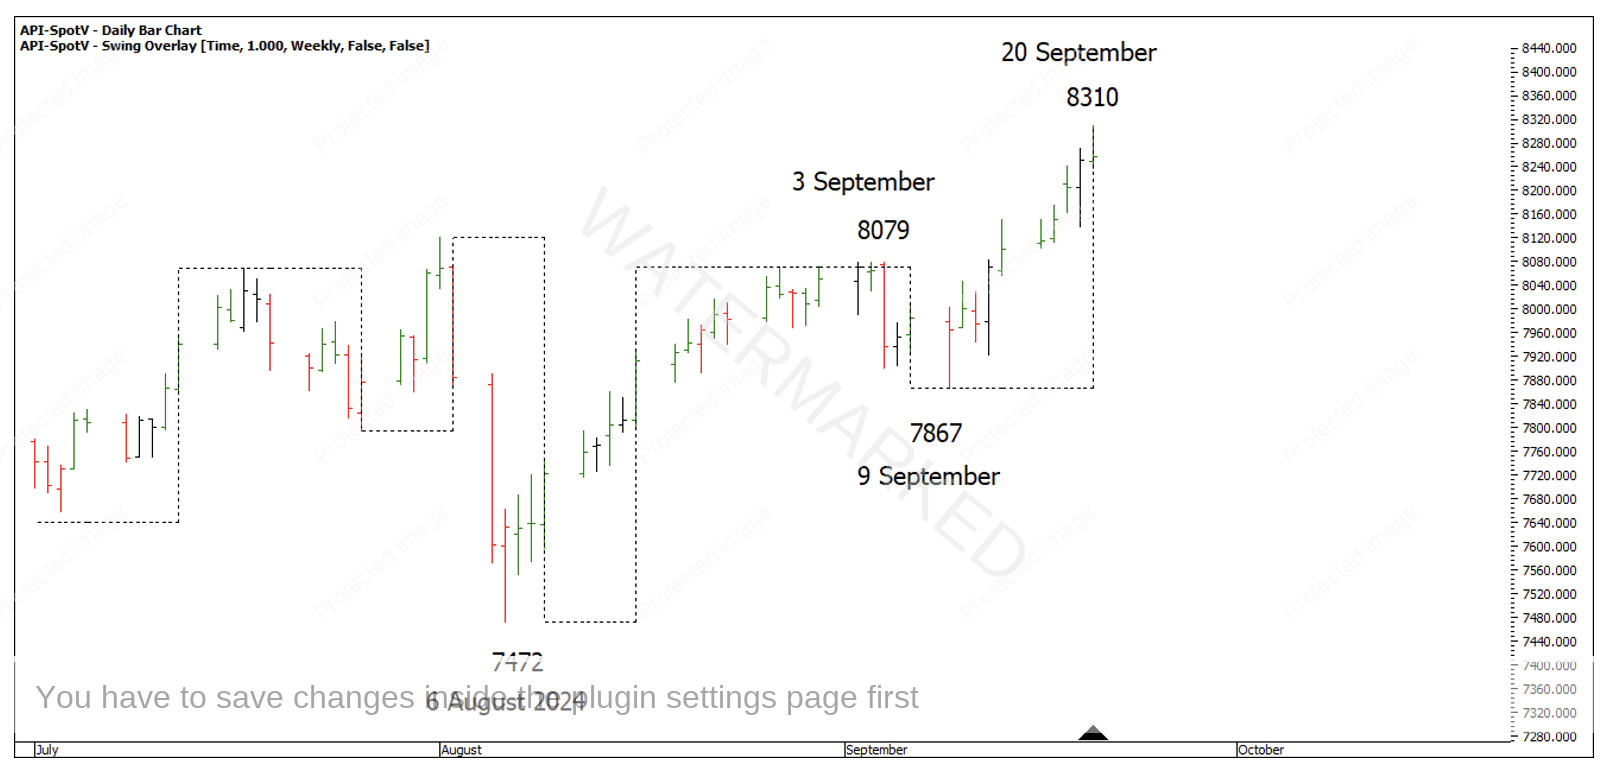
If we take the close pattern on Friday 20 September on the SPI200, it would suggest the following week is an up week as Friday’s close is just above the open and above Thursday’s close.
Chart 3 – SPI200
Remembering it has a 65% hit rate means 35% of the time it doesn’t work. I will point you in the direction of two other tests you could run.
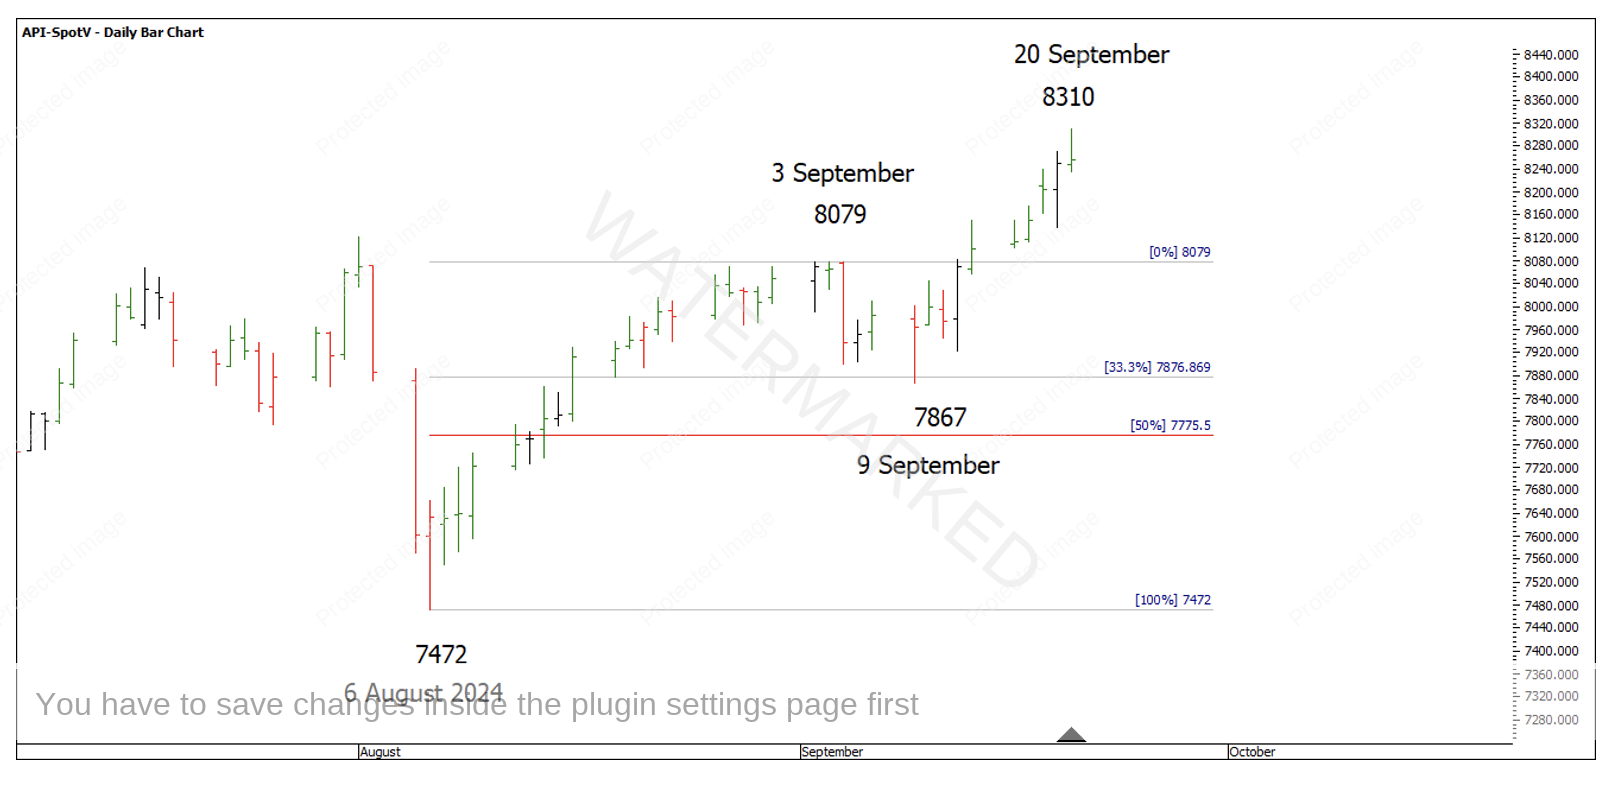
Firstly, the weekly swing pull-back into 9 September was a 33% retracement. Test how far the next weekly swing is likely to go after a 33% retracement. Then, over the next few weeks to months, what generally happens? I’ll make it easy and say that not many weekly Point C’s for a long trade come in on a 33% retracement, actually it’s the first one in just over 10 years, so I would test a 37.5% retracement.
Chart 4 – 33% Weekly Swing Retracement
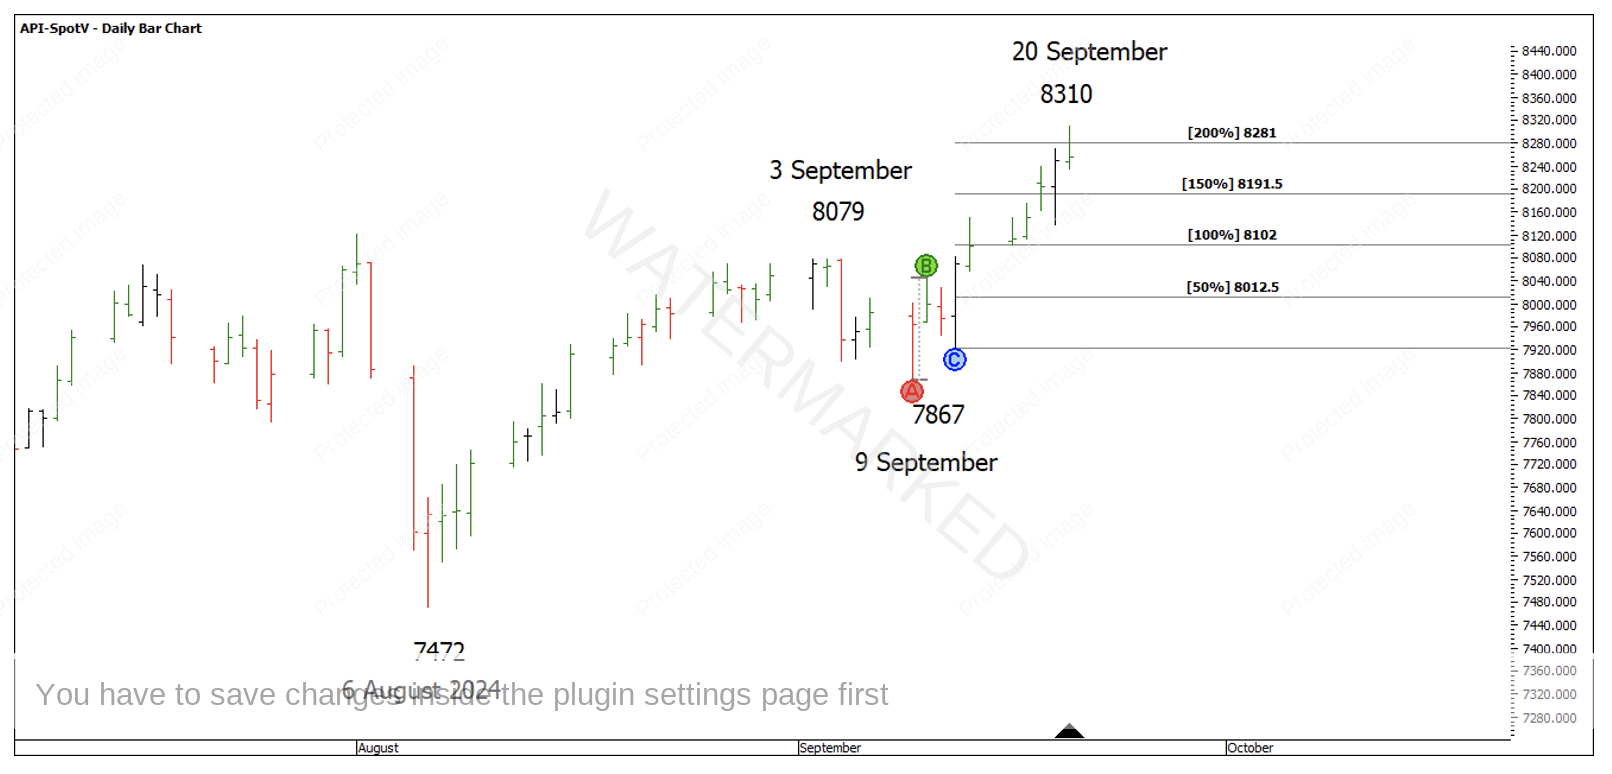
The second test is, what percentage of weekly swings hit 200% of the daily First Range Out and what percentage of weekly swings go past 200% of the daily First Range Out. For this test I would ignore a daily swing caused by an outside bar and stick to legitimate one, two and three day swings.
Chart 5 – 200% Daily First Range Out
If I refer back to Chart 1, David suggests that 15% of trades get to the 133% milestone, so on the flipside if the market does reach that point, is there an 85% chance that the market stops there? If so, that’s an incredibly powerful statistic to have.
This market is still in all-time highs, so at this stage, I’ll be keeping a close eye on old tops becoming new bottoms for the next weekly Point C or a higher daily swing bottom retest trade after a strong Friday close pattern, that has me trading in sympathy with the weekly trend.
Happy Trading,
Gus Hingeley
