What Goes Up, Must Come Down
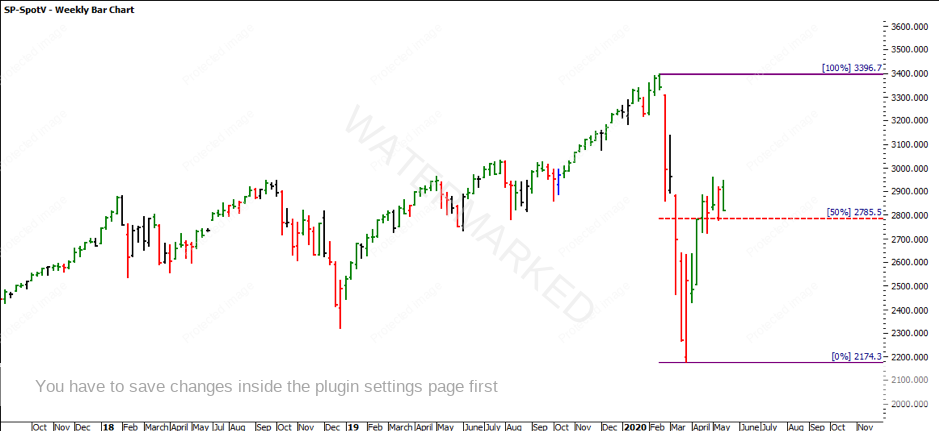
Isaac Newton coined the term ‘what goes up, must come down’, with his Law of Universal Gravity. As you have witnessed, we have seen the global markets follow this universal law and move from extreme highs and back down again. The S&P500 high of 3,396.7 fell to a low of 2,174.3 in the space of four weeks. That is close to a 36% drop in price from its high. The market currently sits at 2,818.4 (as of the 13th of May 2020), making a 30% come back from its pandemic low and now showing around a 17% drop from its All-Time Highs.

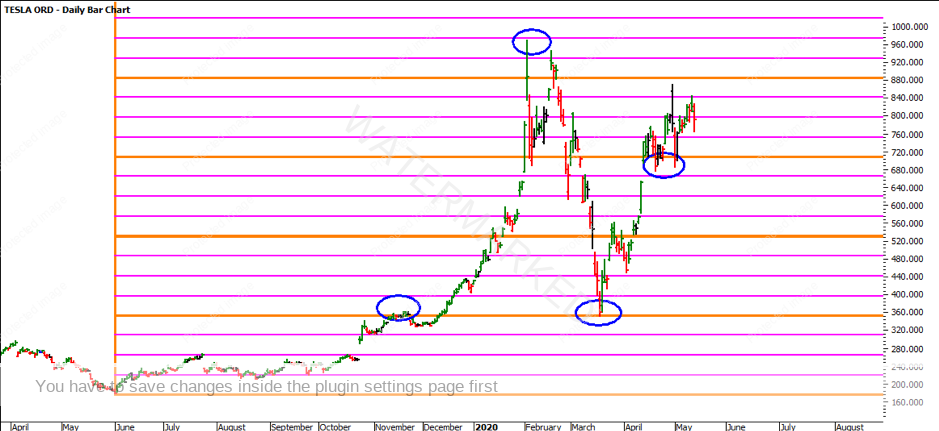
In my recent TSLA articles, we watched the market rally from $176.99 to $968.99, to then see the market tumble back down during the Global COVID-19 Pandemic. TSLA currently trades at $790.96 (as of the 13th of May 2020), which is 26% from its All-Time High. This has been a relatively strong recovery, having dropped 63% during the pandemic. The market has come back and sat on the previous All-Time High in 2017 at $389.61. Gann mentioned that old tops become new bottoms.

Treating each market individually and applying Price Forecasting techniques from Section 11 of the Number One Trading Plan, you can see in the chart below that taking the range of the ATL to the ATH from $14.98 to $389.61 (range of $374.63) and projecting this from the low at $176.99, the 200% milestone comes in at $926.25.

Applying the Lows Resistance Card (LRC) to the 3rd of June 2019 low at $176.99, you can see that the market has respected this LRC, having reacted off the 200% multiple pressure point at $353.98. Notice how the market also fell to this level as well. The ATH on TSLA came in at $968.99 which is close to 550% of the June 2019 low ($176.99 x 5.5 = $973.44).

Taking the Highs Resistance Card (HRC) from the ATH at $968.99, the 50% pressure point comes in at $484.50. The market moved through 50% quickly and found support at 37.5%; 5/12 of the ATH.

This is an obvious cluster here, but the question is would you have enough confidence to buy the market? Probably not for the faint-hearted, however if you were watching these pressure points combined with the 2-day swing chart you would have had a good chance to accumulate a position around the ATH 50% level with confidence.
As you can see the market rallied $209.49 from the low on the 18th of March 2020. This was an expanding upside swing range. The retracement that followed was $113.60 which was contracting compared to the previous range of $456.47. It would be at this point that you would be anticipating and looking to enter the market. Assuming you entered on the 2-day swing chart, First Higher Swing Bottom, the entry would be around $515.50.

The market has continually made 2-day higher swing bottoms. We have recently seen the swing high on the 30th of April contracting and the downside ranges expanding. For those who have done a little bit with Time Analysis, you will also note that the ATH to the COVID19 low was 43 days and projecting 43 days from the COVID19 low comes out at April. So maybe we are starting to see the Winter of this section, but only time will tell.
It’s Your Perception
Robert Steer