What to Make of Brexit?
Let’s take a moment to explore the FTSE 100 and Brexit’s impact.
Of all the new words that have entered the modern-day vernacular, the one that would likely be the most recognisable globally is Brexit. What started as a catch cry to unite those in the UK that wished to leave the EU is now associated with a complete failure on all fronts. Whilst my views are irrelevant on what should or should not occur, the term Brexit will forever be associated with a remarkable time in UK history and the finish line to this saga looks well and truly some distance away.
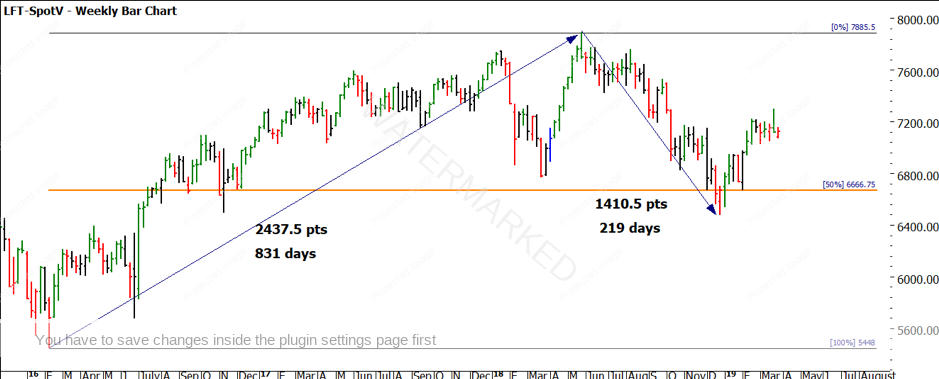
A quick Google of the word Brexit shows me 576 000 000 entries, the good news for us is no matter how much more is written about it (including this article) we can create and execute opportunities in the short and medium term. Looking at Chart 1, we can see the weekly bar chart of the FTSE 100 (LFT-Spotv), which represents a stock index futures contract based on 100 UK shares.

Chart 1 – Weekly Bar Chart FTSE 100
Since the referendum on the 23 June 2016, the price action surged higher from 5448 to the recent highs in 2018 of 7888.5, with the bull run of over 2000 points adding 40% to value of the index over 2.5 years. We could argue that stock markets are a better pricing mechanism as they are a forward-looking valuation, and clearly, the concern of a Brexit did not weigh in a bearish sense. Since the high in 2018, we have seen a pullback to the 50% level (spoken about by Gann well before the term Brexit was ever coined). That decline aligned with the global move in equities and the rally from December is also in line with global markets. The price level of 7200 will be a key area to watch.
I recently used the example of the FTSE to show someone in the
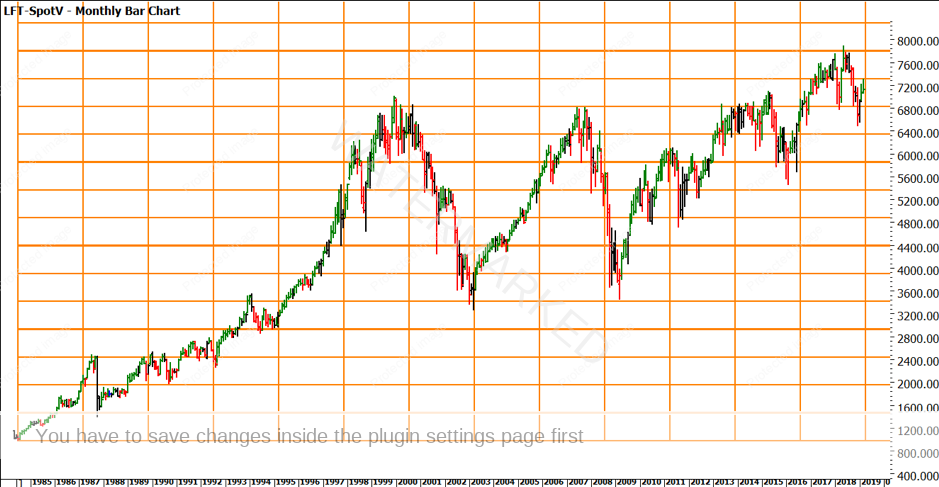
It’s critical that you do the work as opposed to taking my word for it. Chart 2 shows a lows resistance card from the 1984 low. The price of the low is 975 points (this is also the case of an all-time low on another market I follow ![]() )
)

Chart 2 – Monthly Bar Chart FTSE 100
The key areas to note here are the major lows from 2003, 2009, 2016 and the recent low in 2018. The challenge is to understand what these 4 lows have in common. The first clue will come from the low’s resistance card.
My next suggestion would be to break down the runs into these four lows and see if there are any similarities, remember to look for expansion and contraction of known time frames and price ranges.
To give us a sense of the current trends in this market we, of course, turn to our swing charts. I am sure if you asked the person on the street, they would likely have a different view (when looking purely at the headlines.)
| 1 Day Trend | Uncertain |
| 2 Day Trend | Up |
| 3 Day Trend | Up |
| 1 Week Trend | Up |
| 1 Month Trend | Up |
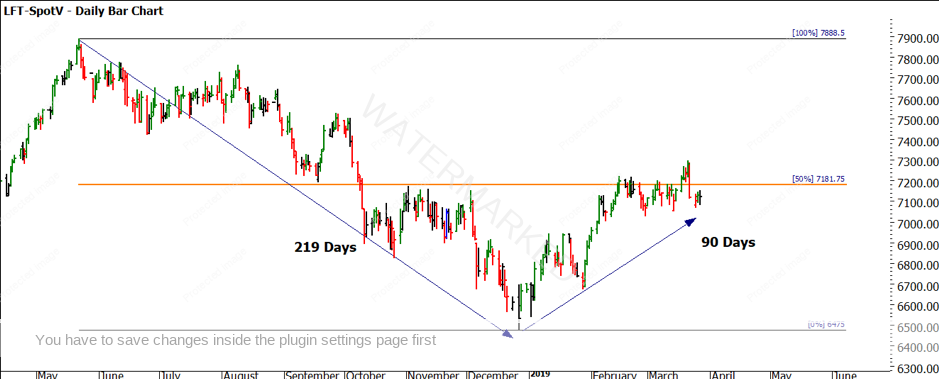
If we zoom into the current picture, we see the price action has stalled at 50% of the bear range of 2018. The “easy money” on the long side has probably been made in the moves from late January. The greatest asset we have is we don’t have to be in the market all the time, waiting for some confirmation of a break above 7181.5 would be wise as the market has stalled a number of times at that level.

Chart 3 – Daily Bar Chart FTSE 100
If we consider that
If you are to be an independent trader, you must ignore the “noise” including me. This allows you to focus on
With regards to the future of the UK and the impact of Brexit I cannot tell you what will,
Good trading,
Aaron Lynch