What’s in a Number?
Welcome to the new financial year and the opportunities that will follow. No doubt like many of us you are finding the new normal is dragging on longer than any of us would hope for as we navigate the COVID world. Markets, like people, can get into a malaise and we might say that of the SPI200 as it has been hovering around the 6000 level plus and minus for the last few weeks.
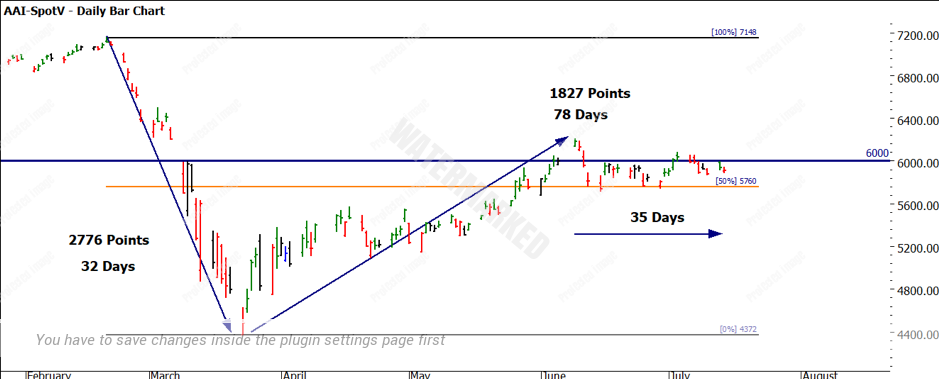
A quick recap tells us that 2020 has provided two directions to trade, the February top into the March bottom followed by the recovery to where we are now. These two sections alone on multiple markets have offered high reward to risk opportunities and now we might argue a calm has formed before the potential for more moves. Chart 1 shows the SPI200 and the current sideways direction around the 6000-point level. Markets often use round numbers as a magnet to gravitate around whilst resting for the next move.
Chart 1 – SPI200 Daily Bar Chart
The moves have been sharp when we consider the points and days ratio, and since the June 9th high we have been predominately sideways (holding the 50% milestone in orange) but not being able to close consistently above 6000 points.
Given the uncertainty around the global and domestic economies, it is fair to say there is some fatigue in the participants. There is also value in looking at the position of the underlying stocks that make up the index and in Australia we are best placed to watch the top 10 to 20 by market capitalisation to understand what stocks are moving the index and vice versa. The current players in the top three see Commonwealth Bank, CSL and BHP as the market heavyweights in terms of size.
Only one of those three, CSL, has grown by market cap in 2020 with banks and miners shrinking in 2020. BHP is a Safety favourite with exercises in the Smarter Starter Pack being tested on this market. A quick reminder if you have never put pen to paper and undertaken the lessons in your Smarter Starter Pack, then there is no better time than now.
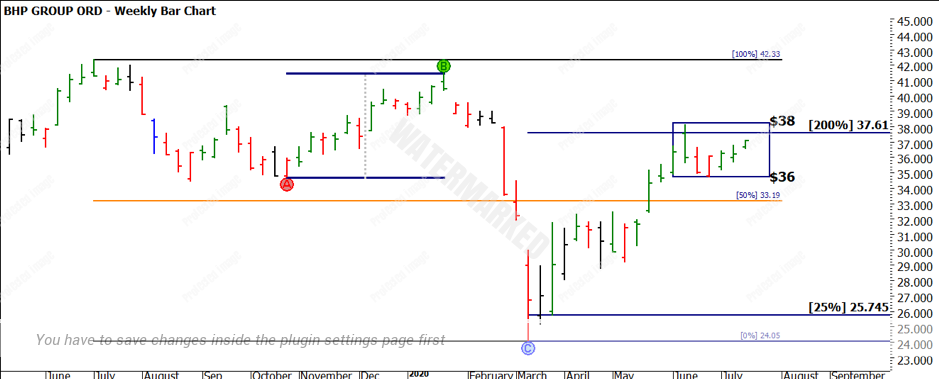
Chart 2 looks at the 2020 moves and the current sideways pattern between $36 and $38.
Chart 2 – BHP Weekly Bar Chart
By jumping deeper into the index movers and shakers this can assist us with our view on what the next moves could be on the bigger picture, especially if you find yourself in a sideways pattern that could be accumulation or distribution.
Of note on BHP is that the price action is holding well above the 50% milestone of the current bearish range over the last 12 months. I have also tagged the October to January range and projected from the March low this year. We see the current high in June was a reversal bar on the weekly chart at approximately 200% of the A to B range.
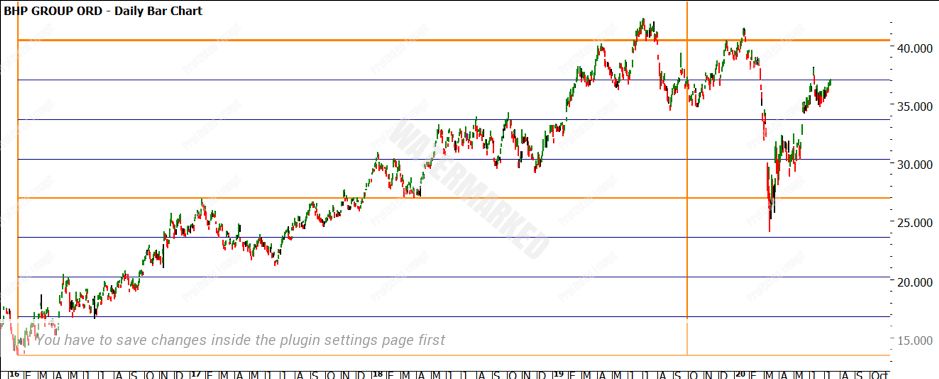
The next chart on BHP is a day-long lesson, Chart 3 cements the value of a Lows Resistance Card and using multiples of the low for support and resistance levels.
Chart 3 – BHP Daily Bar Chart $13.48 2016 Low
The value of this chart shows many tradeable turns are delivered around multiples of lows, you could look for a double bottom, double top, first higher swing bottom and first lower swing top trades in this timeline of the market. The chances of increasing probabilities on successful trades is enhanced with this extra filter.
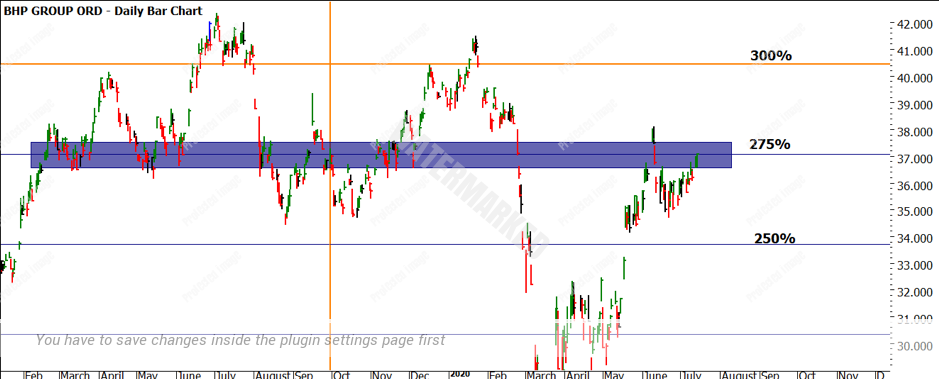
To the current position of the market, BHP has moved one full multiple of the low in 2020 from the high in January to March. As it has recovered it now sits just under the 275% level.
Chart 4 shows the history of how this area has acted both as support and resistance in the last 12 months. This could be a level to consider when applying both to BHP and the SPI200.
Chart 4 – BHP Daily Bar Chart
I encourage you to perform this same scouting exercise on CBA.ASX and CSL.ASX as a technique to add an additional filter to your work on the SPI200. The more confirmation we can add on our analysis from a broad range of markets then we can layer confidence into our market-specific trading plans. It goes without saying we can add the swing ranges from the swing chart to our analysis as I currently see some interesting harmonies on the SPI200 daily swing chart to consider.
This type of analysis may be something you have not combined before with your work on a stock index. Start simple and get into a good routine before you start applying more advanced techniques.
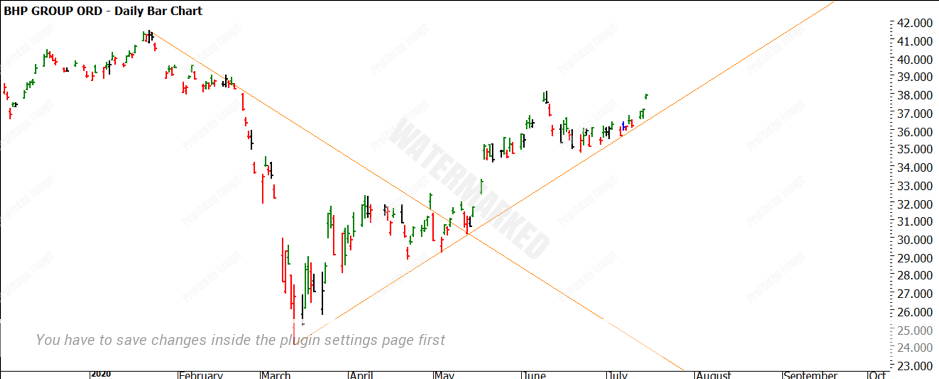
Chart 5 – BHP Daily Bar Chart
I’ll leave you with Chart 5 as another possible step for the more advanced students, again I have used the most recent highs and lows on BHP in 2020 and applied some third dimension work in the form of an angle of the top and bottom. This allows me to understand the movement in price and time away from the turning points. The angles demonstrate there is some support currently so I would be combining this as another filter. If BHP can maintain above the current angle, a rising tide may lift more boats from the index perspective.
Good Trading
Aaron Lynch
