When Will It Trend?
Welcome to 2023 and all that it has to offer, I trust the break was good to you all and that the new year brings a renewed enthusiasm and vigour to markets. The backdrop for 2023 looks likely to move to more economic and geopolitical clouds as the stories of inflation, interest rates, wars and now rogue weather balloons capture the attention.
You will know I am a big fan of routines at the start of the day or the start of the year. Maybe they have become more ritual than routine, but you have to ask what gets you in the game with the right head space. What’s your warm-up routine to ensure you get off to the best start in your trading?
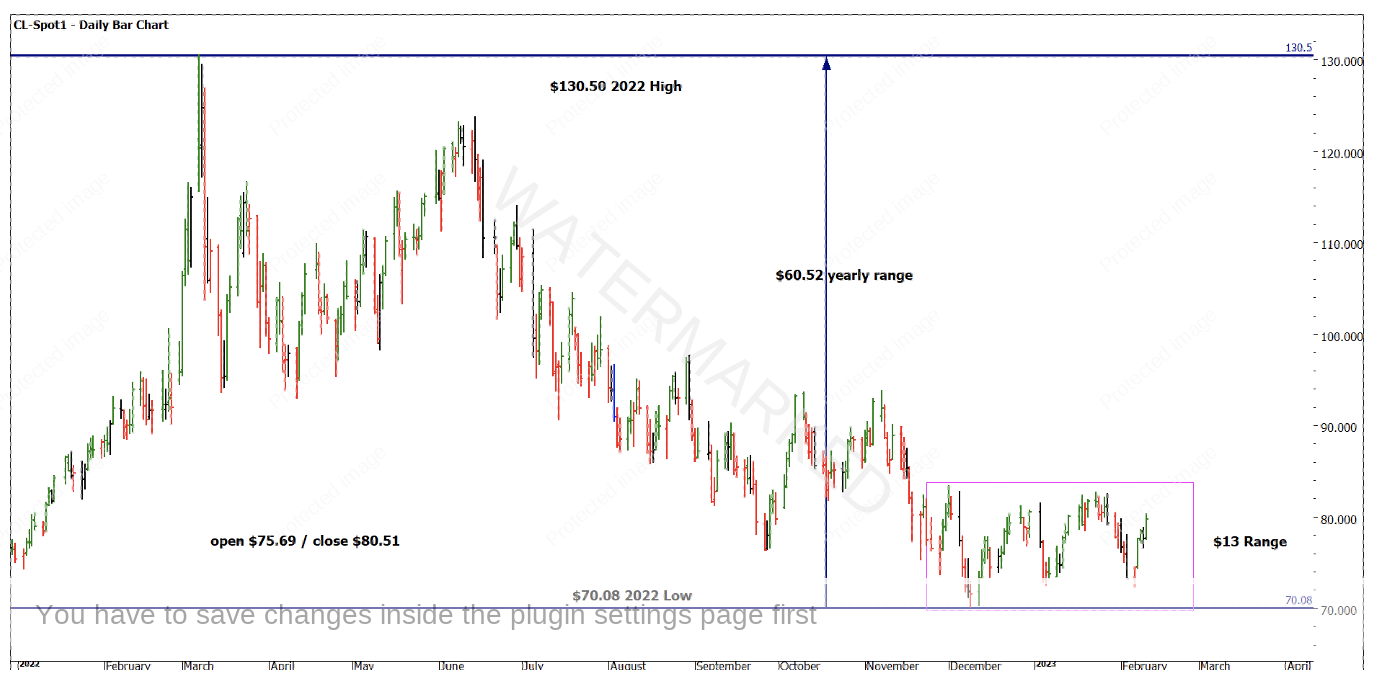
If you follow energy markets like me, you will likely be craving a trend of any sort with 2022 being predominately bearish but recent times being decidedly sideways. Chart 1 shows the range we have been experiencing and its sideways pattern.
Chart 1 – Daily Bar Chart CL-Spot1
The year started and ended within $5 a barrel of January to December. The year range was $60.51 from high to low which shows if we can aim to take 50% of the major moves you are looking at approximately $30 a barrel on offer for those looking to trade with the major trend that was high to low. More likely the easiest trading range to participate in was the June to September down trend, with early April to June as the next best.
My suggestion is to review your trades on your major markets and with the benefit of hindsight line up your trade choices against the major trend. If you are trading the right way, then your analysis of the big picture is working. Now you can look to the trading plan that signals entry and exits to see how you can optimise it. If you find you are long when you should be short and vice versa you should take the time to look at your big picture analysis and work out how to tune that up.
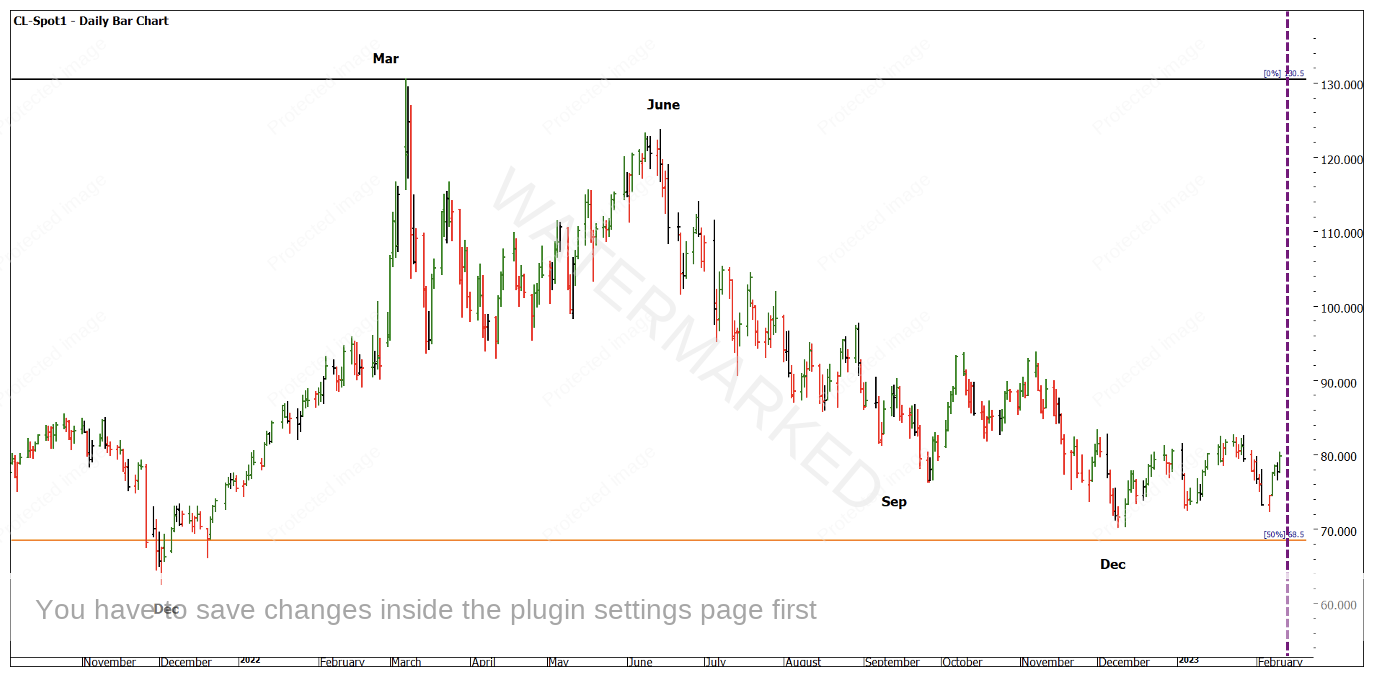
A simple way to set up some timings for the year is to watch anniversaries from the previous year, as David discusses in the Time by Degrees lessons in the Ultimate Gann Course. Chart 2 highlights the two major highs and lows for the year and the low of 2021 which was also early December.
We see March, June, September & December as simple areas to watch for your other analysis to land.
Chart 2 – Daily Bar Chart CL-Spot1
Crude Oil celebrates its 40th birthday this year as a futures contract and no doubt like me you are patiently waiting for the 30th of March this year to celebrate. This also allows us to analyse a good chunk of data to assist our big picture work. By looking at the 3rd year of every decade we can look for patterns. Below is a quick reference of what month the major highs and lows are found.
| 1983 | High | August |
| Low | December | |
| 1993 | High | March |
| Low | December | |
| 2003 | High | February |
| Low | April | |
| 2013 | High | August |
| Low | April |
Can you pick up this information and link back to other anniversary or time count work?
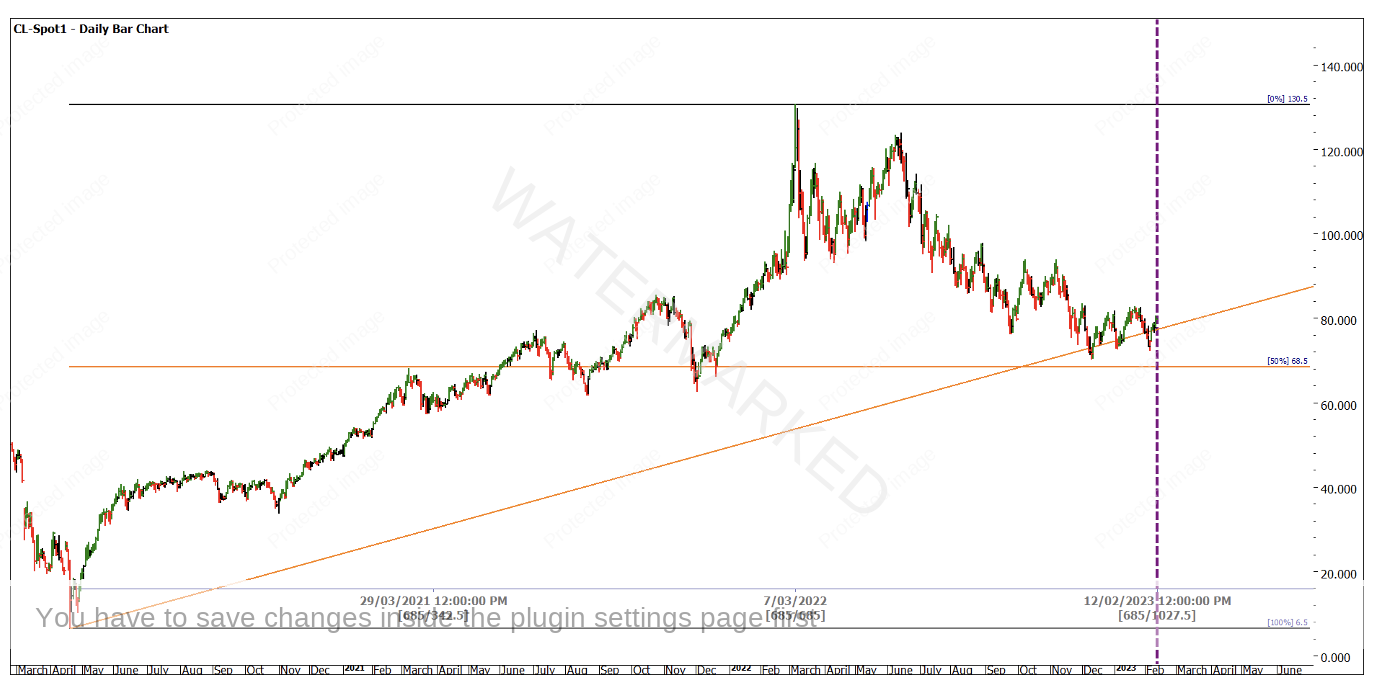
Chart 3 looks to examine the current picture in terms of the market shape and requires us to look at the last few years as we go back to the 2020 low.
The All Time Low of $6.50 was followed by the $130.50 high of 2022 and now prices have retreated back to the $70 level. Using a Ranges Resistance Card we see an approximate 50% pull back and whilst price remains on the upside the next move is likely up.
I have added the time up and down as well. 686 days up is followed by a 50% move down to the 12th of February, which was on Sunday. All we are attempting to understand is where the market sits in terms of time and price. For good measure I have added a 1×1 Gann angle to show the balance point.
Chart 3 – Daily Bar Chart CL-Spot1
The sideways last few weeks could have been building for this time and price point to collide. I will be watching with interest to see which way the market breaks or if it continues sideways.
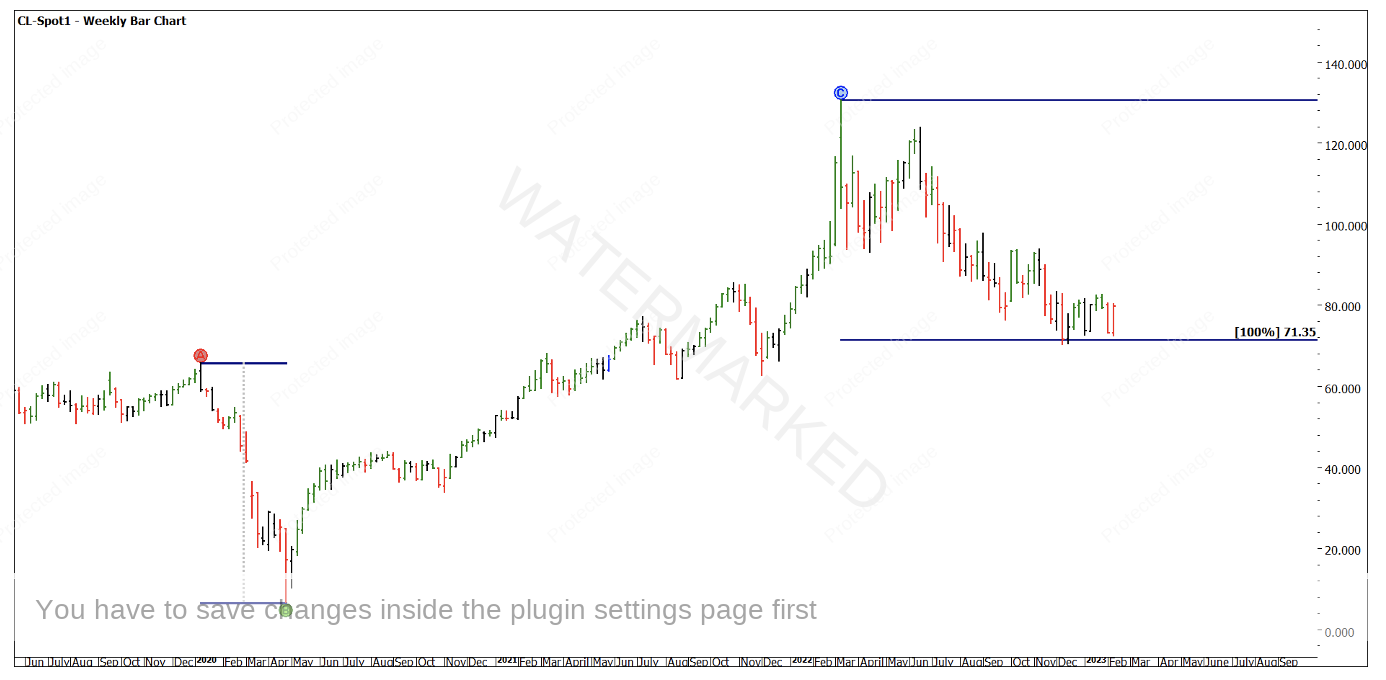
The price aspect shows there are also some added ideas as to why the trends have been less tradeable. Often, after a market runs in a way it has done in the past it will need to take stock and wait for the next cycle to lock into place. Chart 4 compares the run down in 2020 to the current bearish move.
Chart 4 – Daily Bar Chart CL-Spot1
Good Trading
Aaron Lynch


