Where to for Oil?
Welcome to the March 2020 Platinum Newsletter. As I type, we have just seen the March Seasonal Date occur, and most students of Gann would be asking “could this be a date of potential support?” After what has been an absolute rollercoaster ride for most major markets over the last four weeks the question all participants of markets are asking is where to next?
It won’t surprise you that this month’s article will focus on the position and recent trading patterns on the Crude Oil market. We have not seen prices this low for Crude Oil since 2001, so logically we should ask the question could we be retesting the All Time Low of $9.75 back in 1986? We will get to the technical discussion in just a moment but if we look at Crude Oil from a fundamental perspective as the world moves into lockdown across multiple industries in all corners of the globe, we certainly can’t rely on demand to drive the price of Oil higher.
The likely outcome for the cartels producing Oil around the world will be to reduce supply to stabilise prices. This however will be very difficult to achieve given that those major players in the market are unlikely to cut supply as it will affect market share. The other caveat we must incorporate into our analysis is the role the US Dollar plays as the worlds current reserve currency. The bullish pressures on the Dollar are driving it higher and this affects the price of physical Crude Oil.
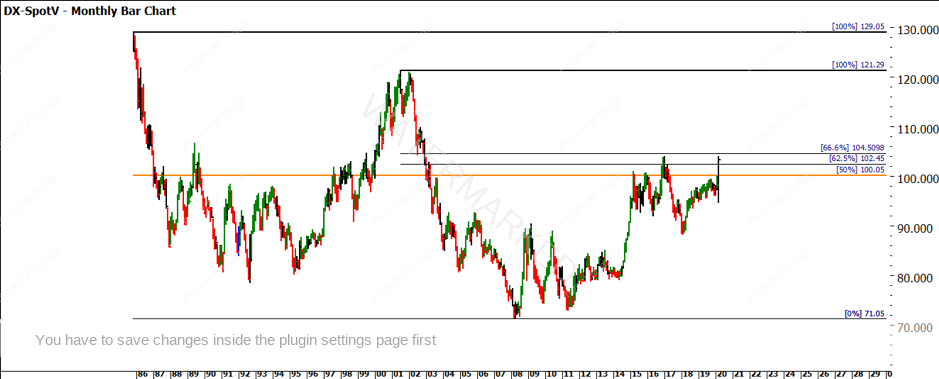
Chart 1 is a basic monthly bar chart on the US Dollar Index, with the price action returning to the previous highs of 2017. We also see the price action trading above the 50% point of the All Time High to All Time Low and approximately the 66.6% milestone of the 2001 high and All Time Low in 2008. If we were expecting a potential low in commodities especially Oil around this time, it’s encouraging to see the US Dollar Index reaching a point of previous resistance at the same time.
Chart 1 – Monthly Bar Chart US Dollar Index
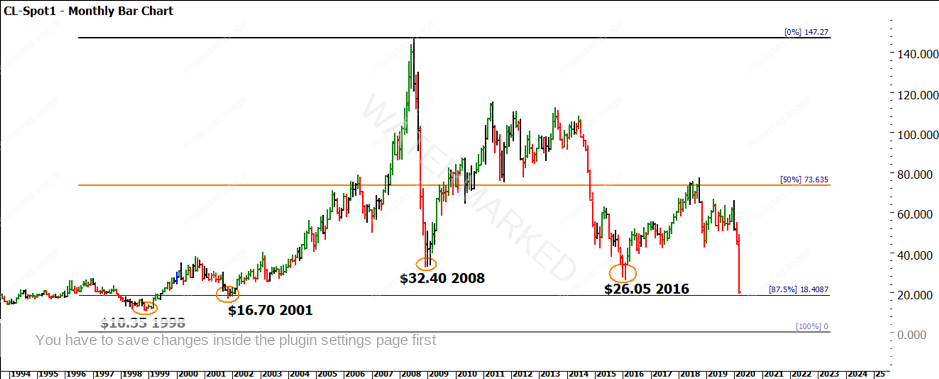
Chart Two shows a monthly bar chart of Crude Oil and the major lows that we have experienced over the last decade or so. It’s important if we are focusing on major lows that we study and understand their relationship to previous major lows of the market we are studying. It’s interesting to note that we have broken both the 2008 and 2016 lows.
A simple analysis without focusing too much on the actual dates in each of the years suggests there are eight years between the previous two major lows. The current year 2020 is 4 years since the 2016 low so a 50% milestone so to speak.
Chart 2 – Monthly Bar Chart Crude Oil
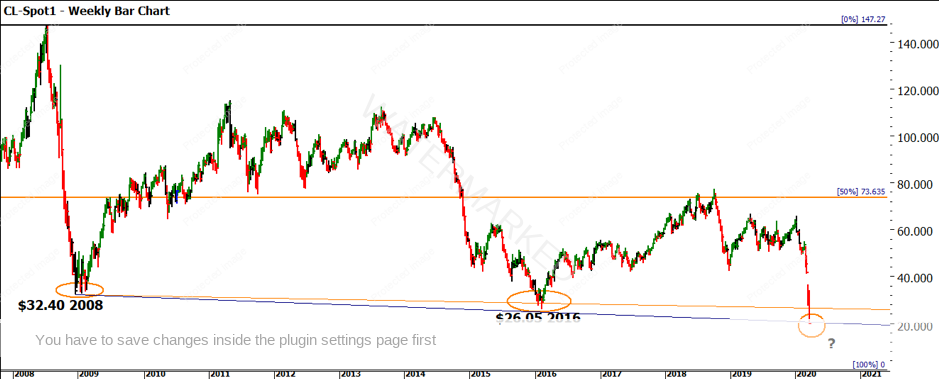
The current low of $19.46 has taken out the previous 2 major lows so we now would look to $16.70 and even $10.35 as potential places to watch if the price action continues to fall over. One way we can associate lows (or highs) especially over large time frames is to use angles to see if there is a time and price relationship. Chart 3 uses the GFC low and weekly angles to see if there is some support (or resistance) to consider.
Chart 3 – Weekly Bar Chart Crude Oil
There is some “food for thought” when we see the 2016 low sits on the 1×1 (weekly angle) and the current low sits on the 2×1. As we use Gann’s lessons on angles, we would expect the 2×1 to offer support, and any bounce to the upside could find the 1×1 as potential resistance. Gann Angles will be covered in detail in our Ultimate Gann Course Coaching in April.
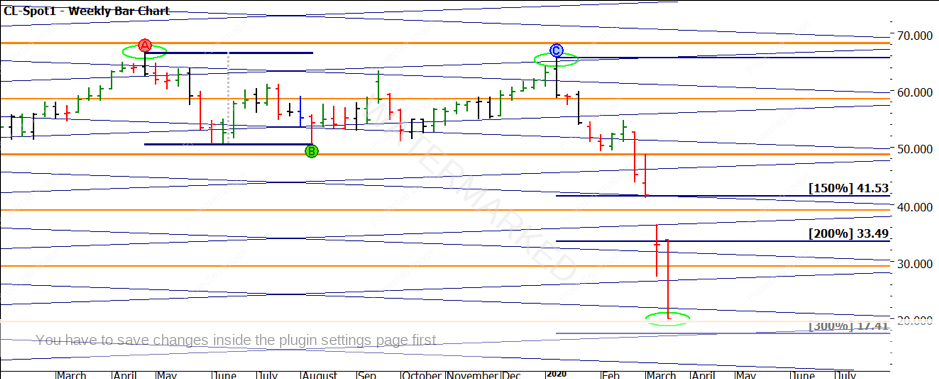
You should always be checking the same big picture charts of your Resistance Cards: Ranges, Highs and Lows. They all currently tell a story but the focus in the next chart is the All Time Lows Resistance Card.
Chart 4 – Weekly Bar Chart Crude Oil
The last year or so has been a perfect time to watch lows squares in action on a market and how they can be applied. The current low ($19.46) sits in the strong part of the square as it has just snuck under the $19.50 which is 2 x the ATL. If we also use the 200% milestone rule of the double tops marked A and B we can see whilst not at 200% we are close to the 300% milestone.
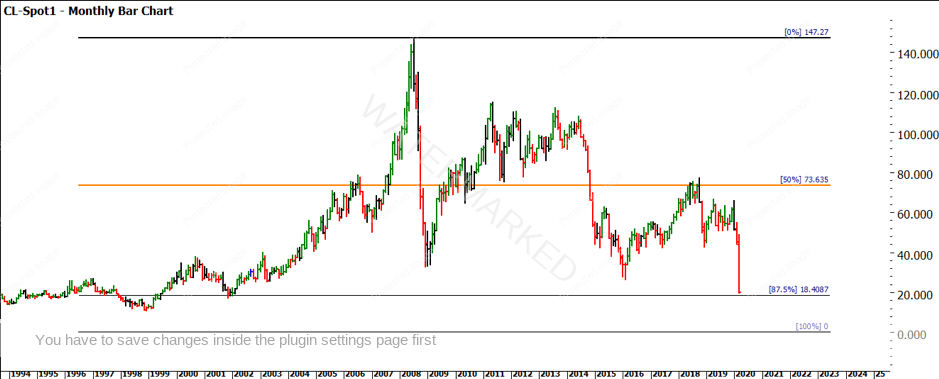
Chart 5 is a Highs Resistance Card and we can see how the mighty have fallen, we are trading close to the 87.5% milestone from the top.
Chart 5– Monthly Bar Chart Crude Oil
If we focus purely on the time side of our analysis there is enough to write a course on what is happening right now, so if Oil is not a market you have put some work into previously there will be too much to undertake in one article to apply successfully. For those who have studied the charts of Crude Oil, the March seasonal time frame is one that always tells a story. There is a regular pattern that sees Crude run from March in April. This often sees the seasonal time and the anniversary of the all-time low act as turning points. We can also add the birth of contract 30 March into the mix and we start to understand why it’s a time to watch.
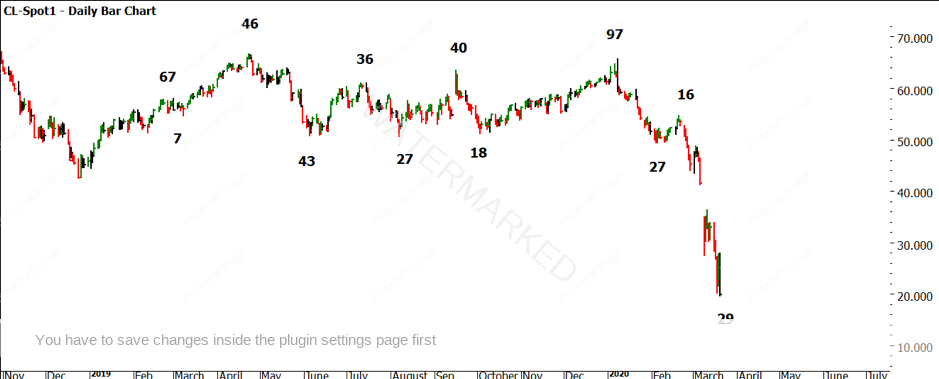
For those that have confirmed various time frames on Oil that work (look to my previous articles) now would be a good time to use the current low as a zero date. Working backwards you should see some previous turns line up to have us thinking we could see a swing low form here. Of course, that is only useful with a trading plan and defined rules to manage risk. The final chart shows a basic time trend of calendar days since the start of 2019.
Chart 6– Daily Bar Chart Crude Oil
The main insights here are looking for repeating time frames and look to understand the percentages of previous swings in time. History is our guide and it is calling the tunes as long as we listen carefully enough.
Good Trading,
Aaron Lynch
