Which Time by Degrees?
In last month’s Platinum Newsletter, I listed a few Time by Degrees dates to watch going forward. A recap of those dates is:
- 22-25 September
- 29 September
- 2-4 October (8-10 degrees)
We’ve seen the market turn on the 8 to 10 degree point at least 4 times in the past year, two of them are only weekly turns but trading opportunities none the less.
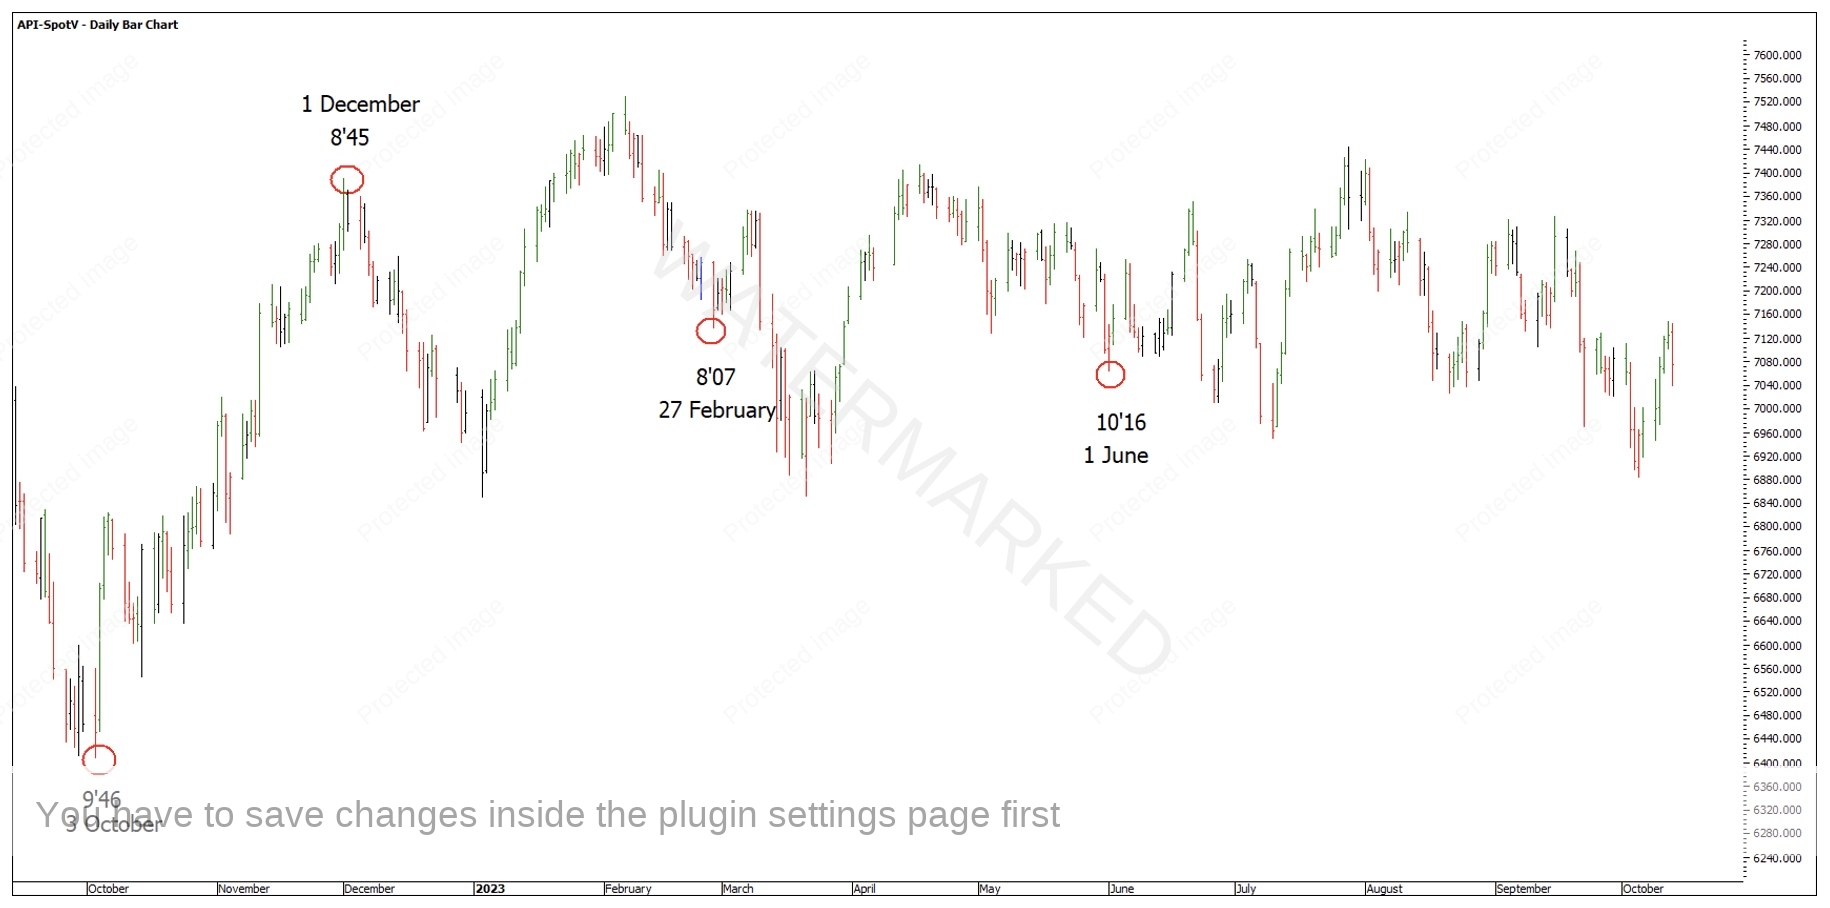
Chart 1 – 8 to 10 Degrees
Looking at Chart 2 below you can see the Time by Degrees dates did a good job of picking up the daily swing turns in late September and early October as listed above.
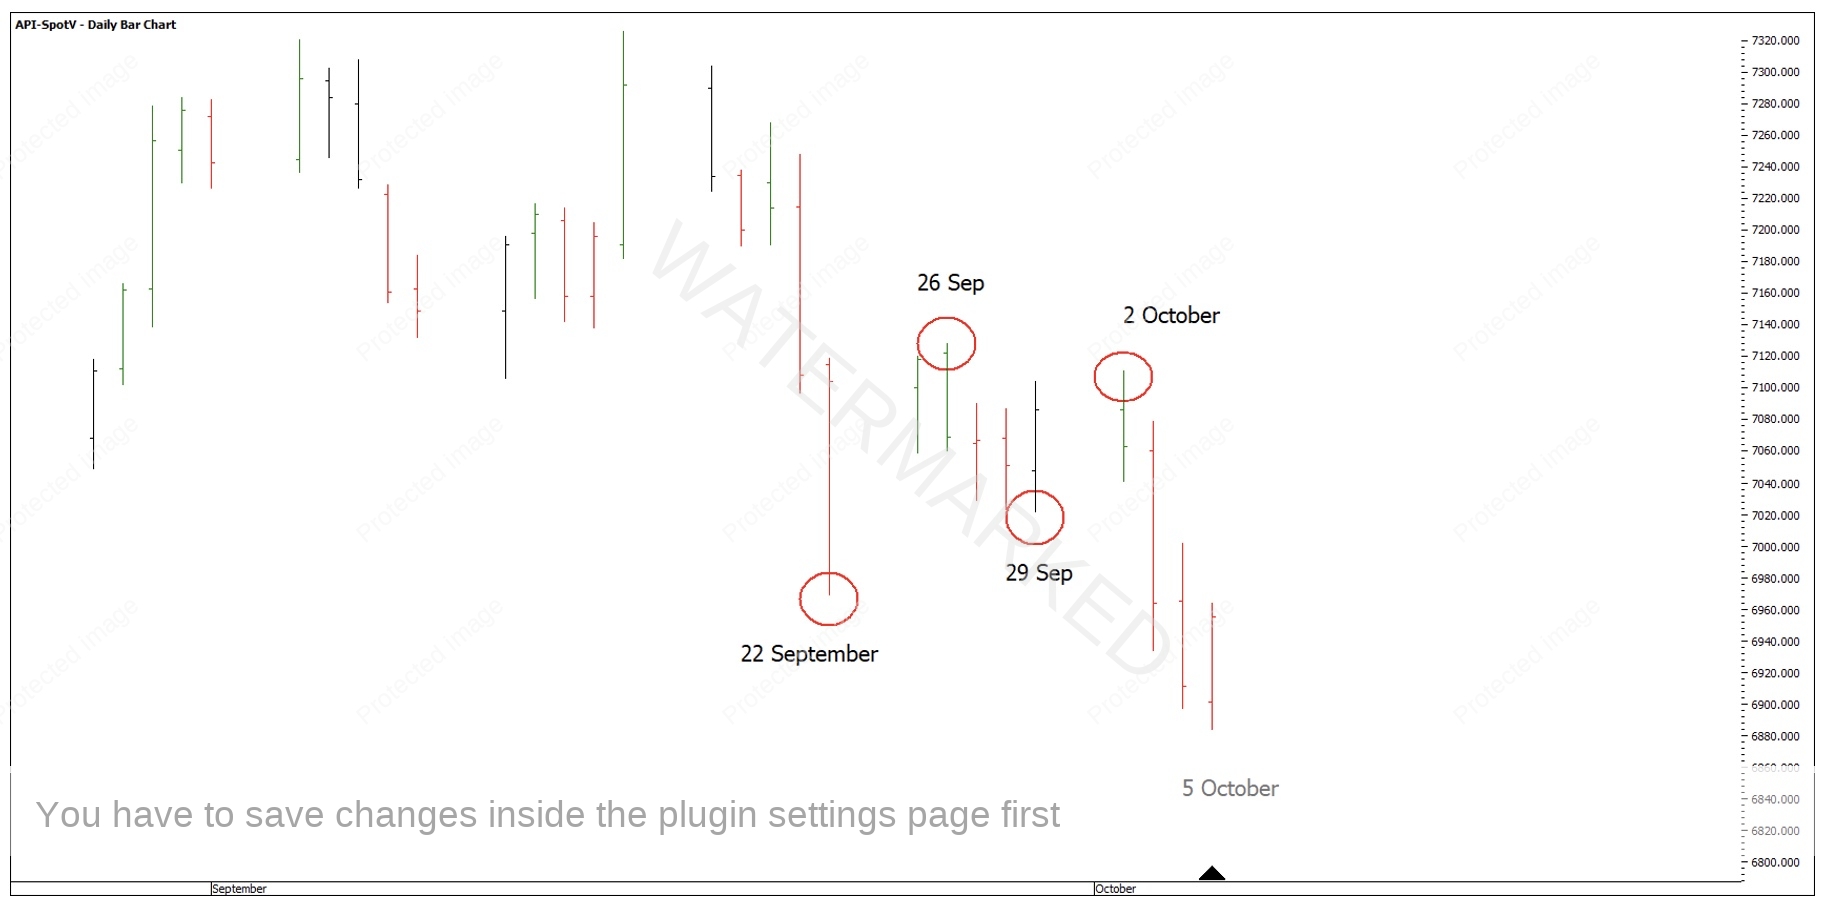
Chart 2 – Time by Degrees
The best date to trade was the 2 October high down to the 5 October low. 26 September was the higher high, but an expanding price and time range up of 159 points in 2 days up, compared with 78 points in 1 day.
David says to compare the last 4 ranges (including the current one) and 159 points in 2 days is the second biggest price swing and the biggest time swing.
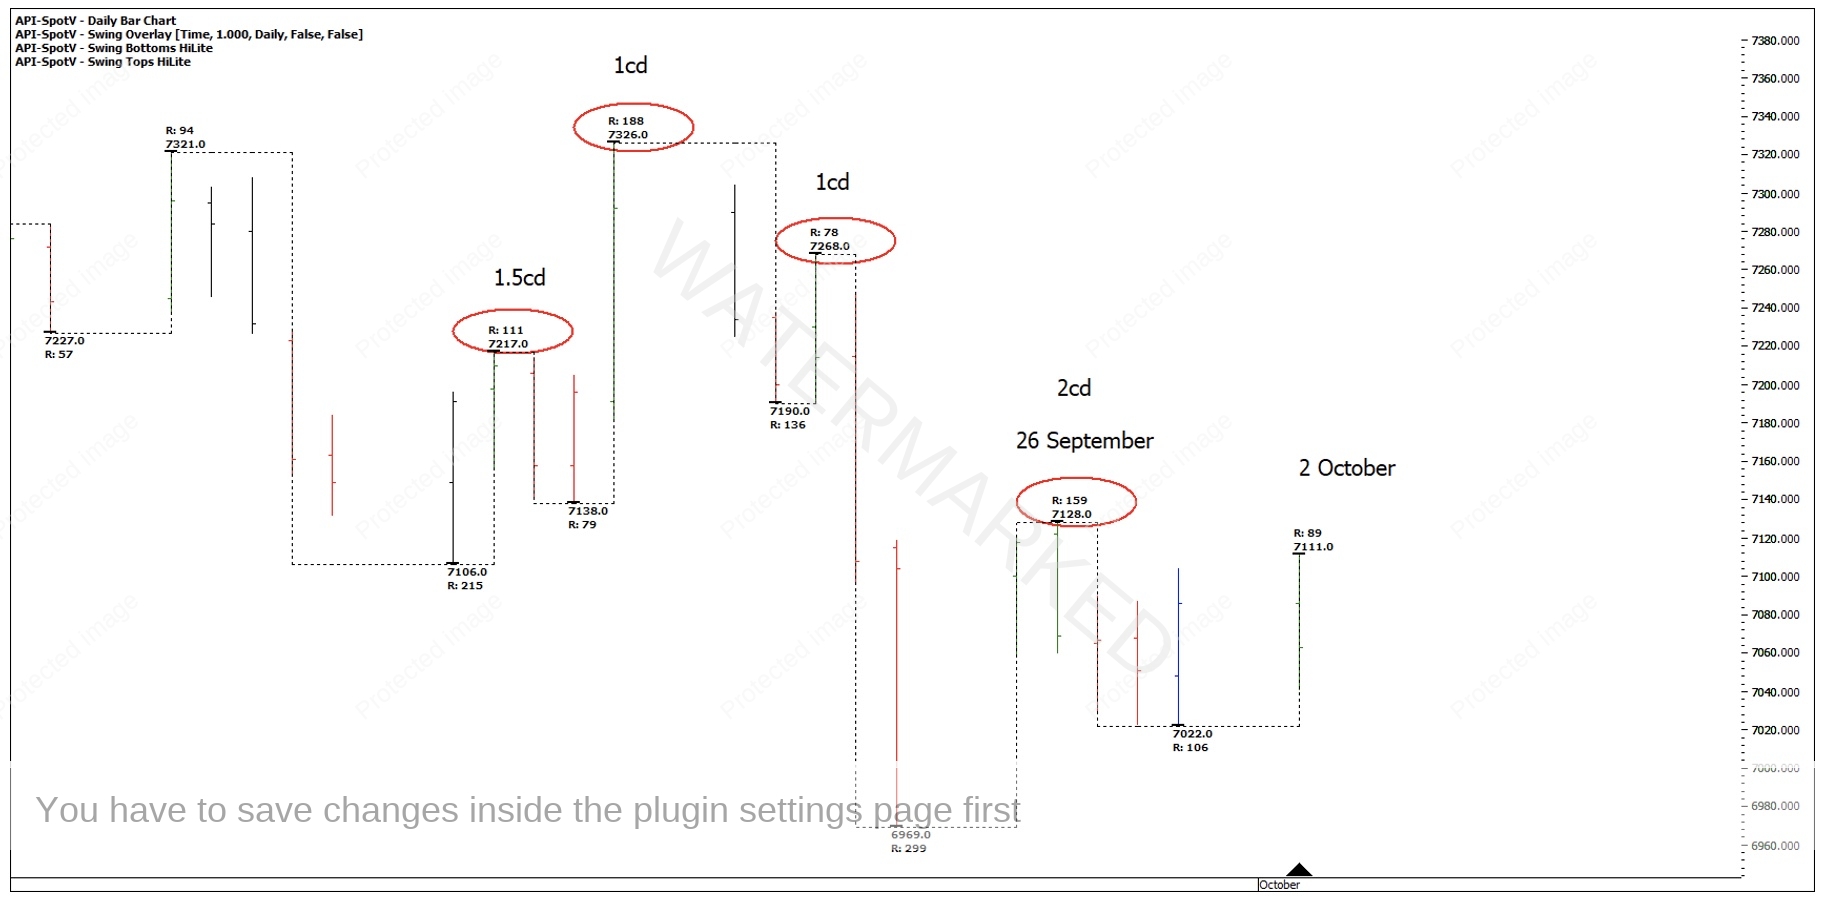
Chart 3 – Time and Price Swings
Running a 2×1 and 1×1 calendar day angle (10 points per day) up from the 22 September low, the SPI was trading above the 2×1 on 26 September. I rate that as a sign of strength and like to see the market trade below the 2×1 before looking to get short.
So with expanding price and time ranges trading above a 2×1, this Time By Degrees day didn’t fulfil my trading plan and was a no trade.
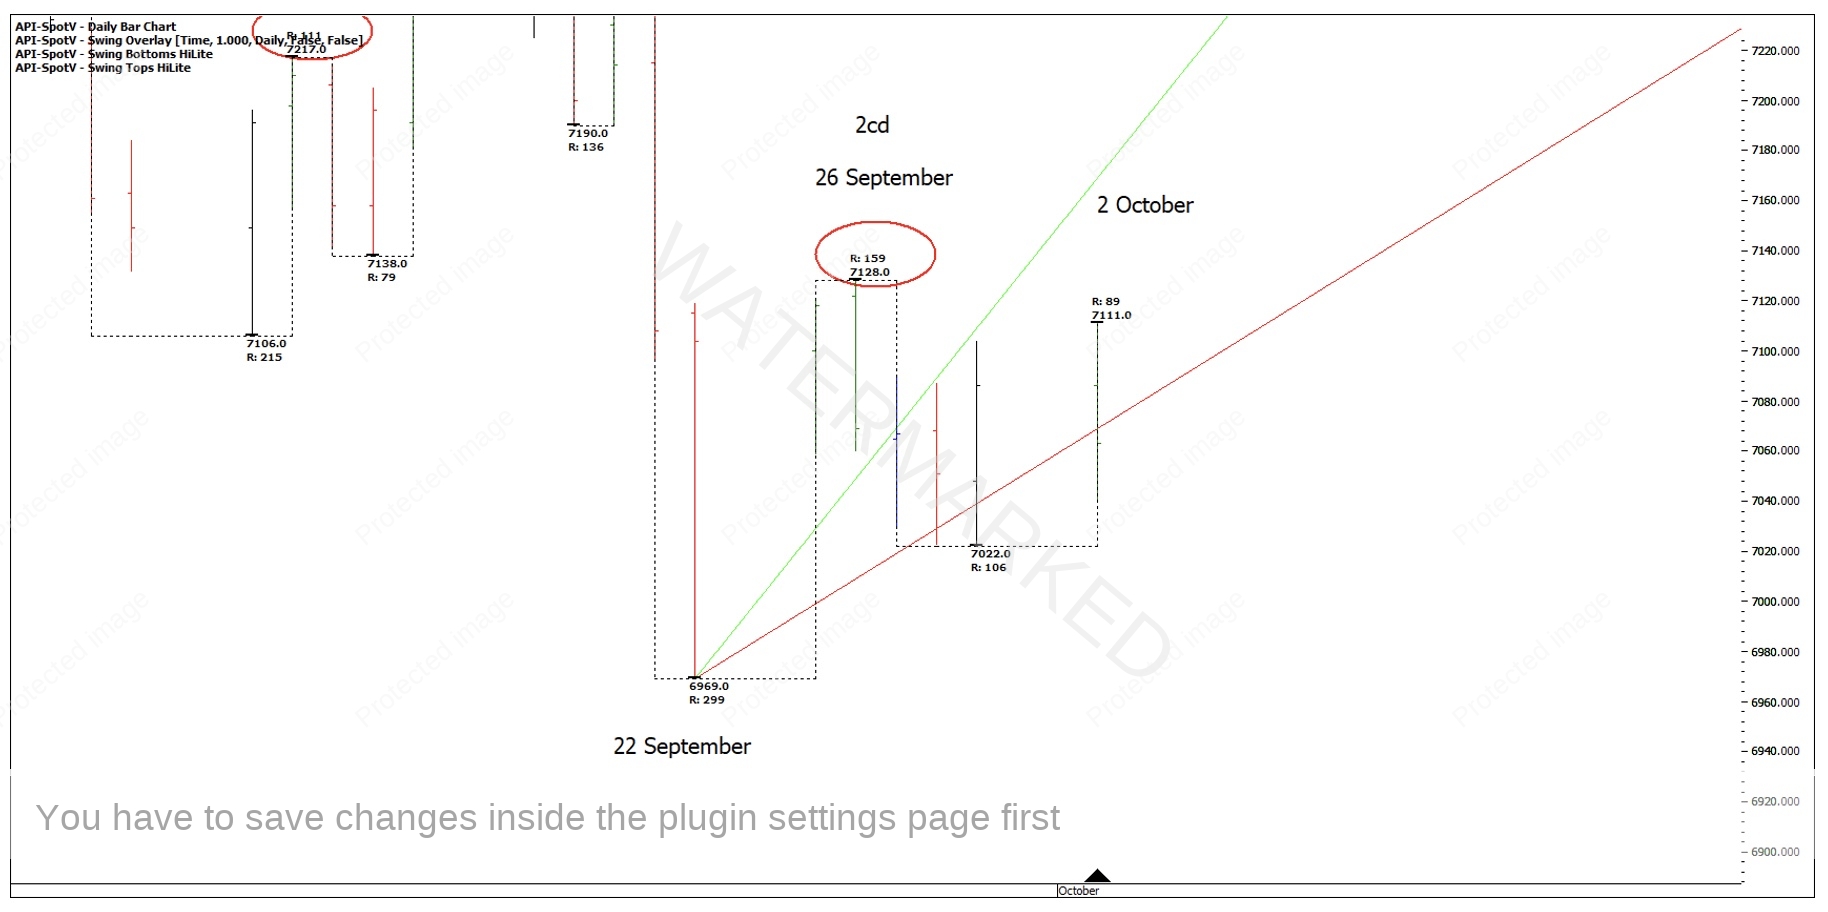
Chart 4 – Gann Angles
Compare that to the 2 October top which was in a very different position. This was a contracting time and price range finding resistance at the 50% milestone of the daily First Range Out, and the second smallest price range of the last four. The market was now well below the 2×1 Gann angle, and in a much weaker position.

Chart 5 – Strength or Weakness
The SPI had also made a top exactly on the 150% milestone of the double tops at 7111, approaching from underneath, acting as resistance.
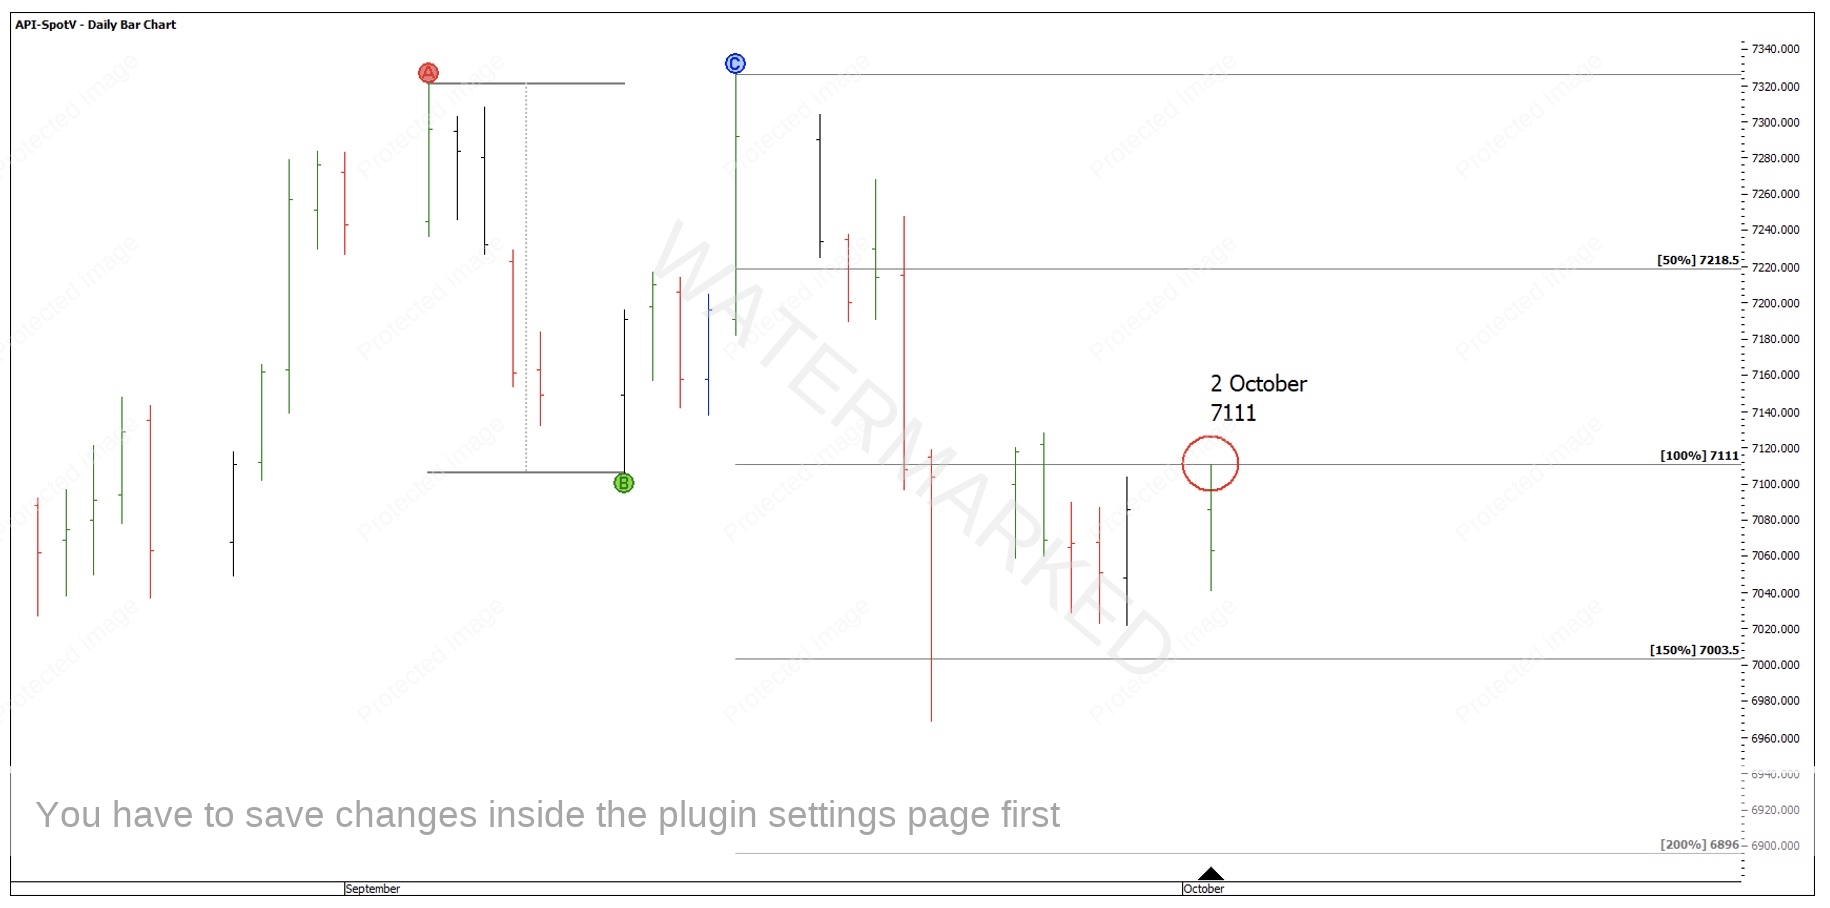
Chart 6 – 150% Milestone Resistance
Drilling down to the 4-hour swing chart, it also failed at the 50% milestone with a final swing up of 44 points, followed by an Overbalance in Price of 70 points, then a contracting range up of 42 points.

Chart 7 – 4 Hour Swing Ranges December Contract
There were two legitimate entries here, as the 4-hour swing chart turned down out of 7111 and then as the 4-hour first lower swing top was confirmed.
This second entry was below the 1×1 Gann Angle after the 4-hour first lower top found this angle as resistance, which shows up as a daily bar high.
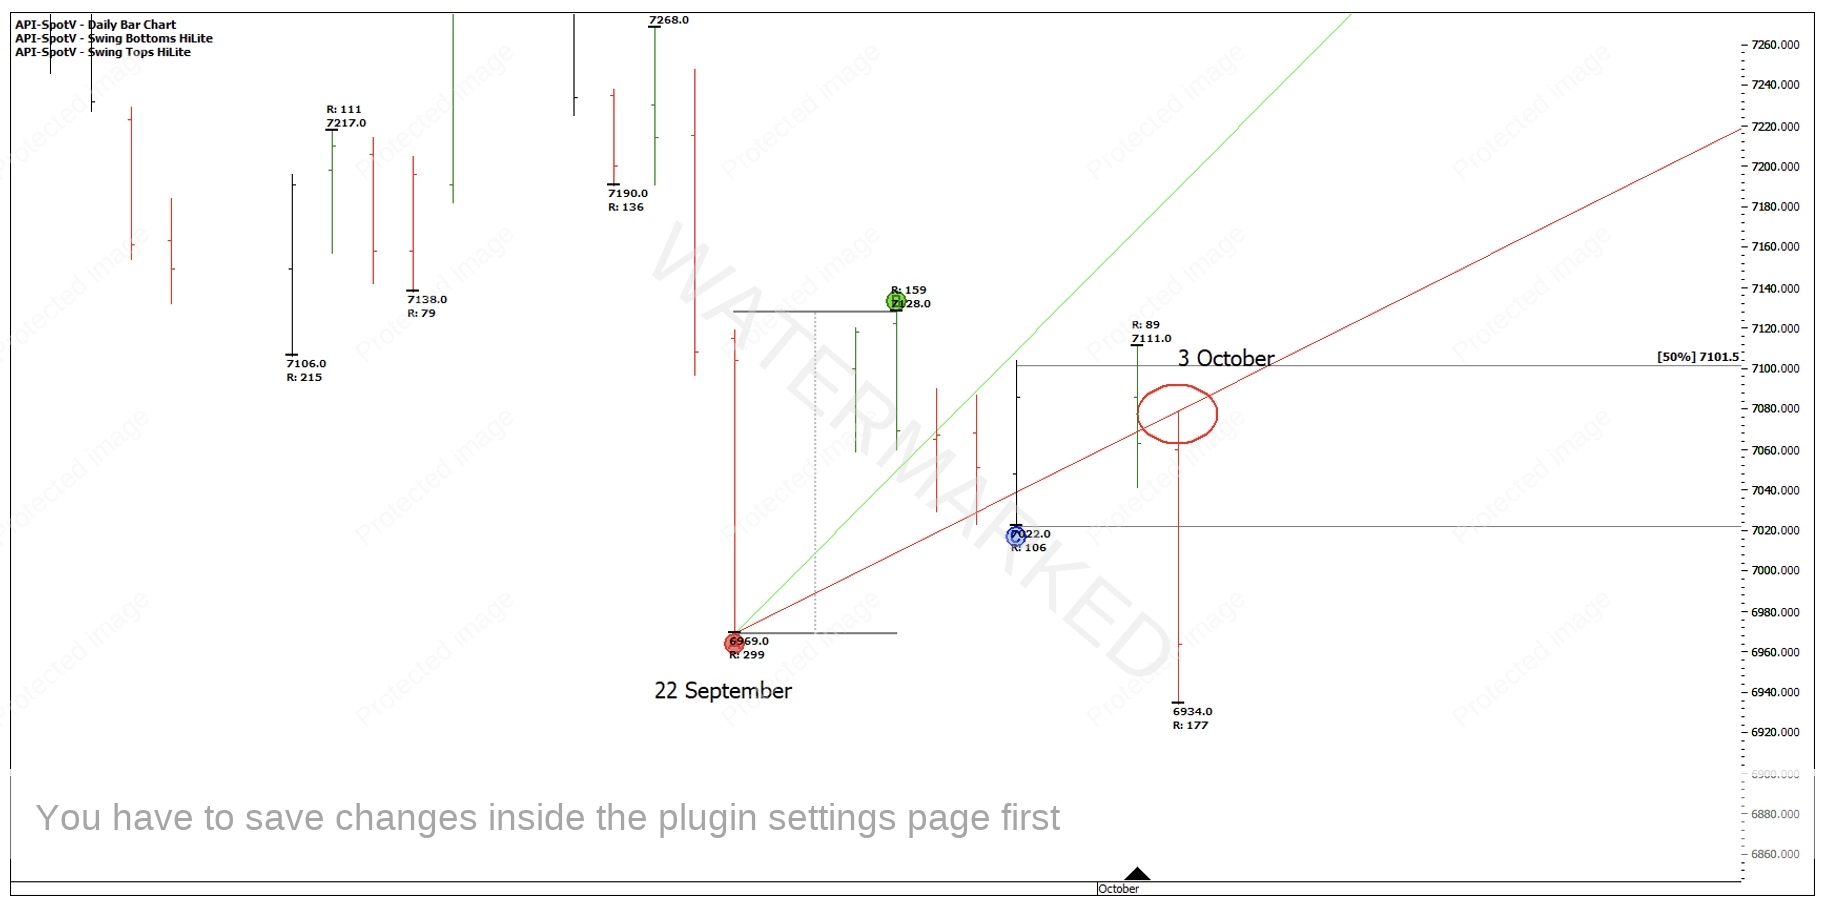
Chart 8 – 4 Hour Swing Entry Below a 1×1
If you had entered into Position 1 as the 4-hour swing turned down at 7090 with a stop at 7112, this gave a risk of 22 points.
If you had entered into Position 2 as the 4-hour First Lower Swing Top was confirmed at 7055 and placed a stop at 7084, this gave a risk of 29 points.
Taking an exit target at 6900, before both 200% milestones were reached, this gave a profit of:
Position 1:
7090 – 6900 = 190 points or 8.6:1 Reward to Risk Ratio (RRR)
Position 2:
7055-6900 = 155 points or 5.3 to 1 RRR
Total = 13.9 to 1 RRR in two trading days.
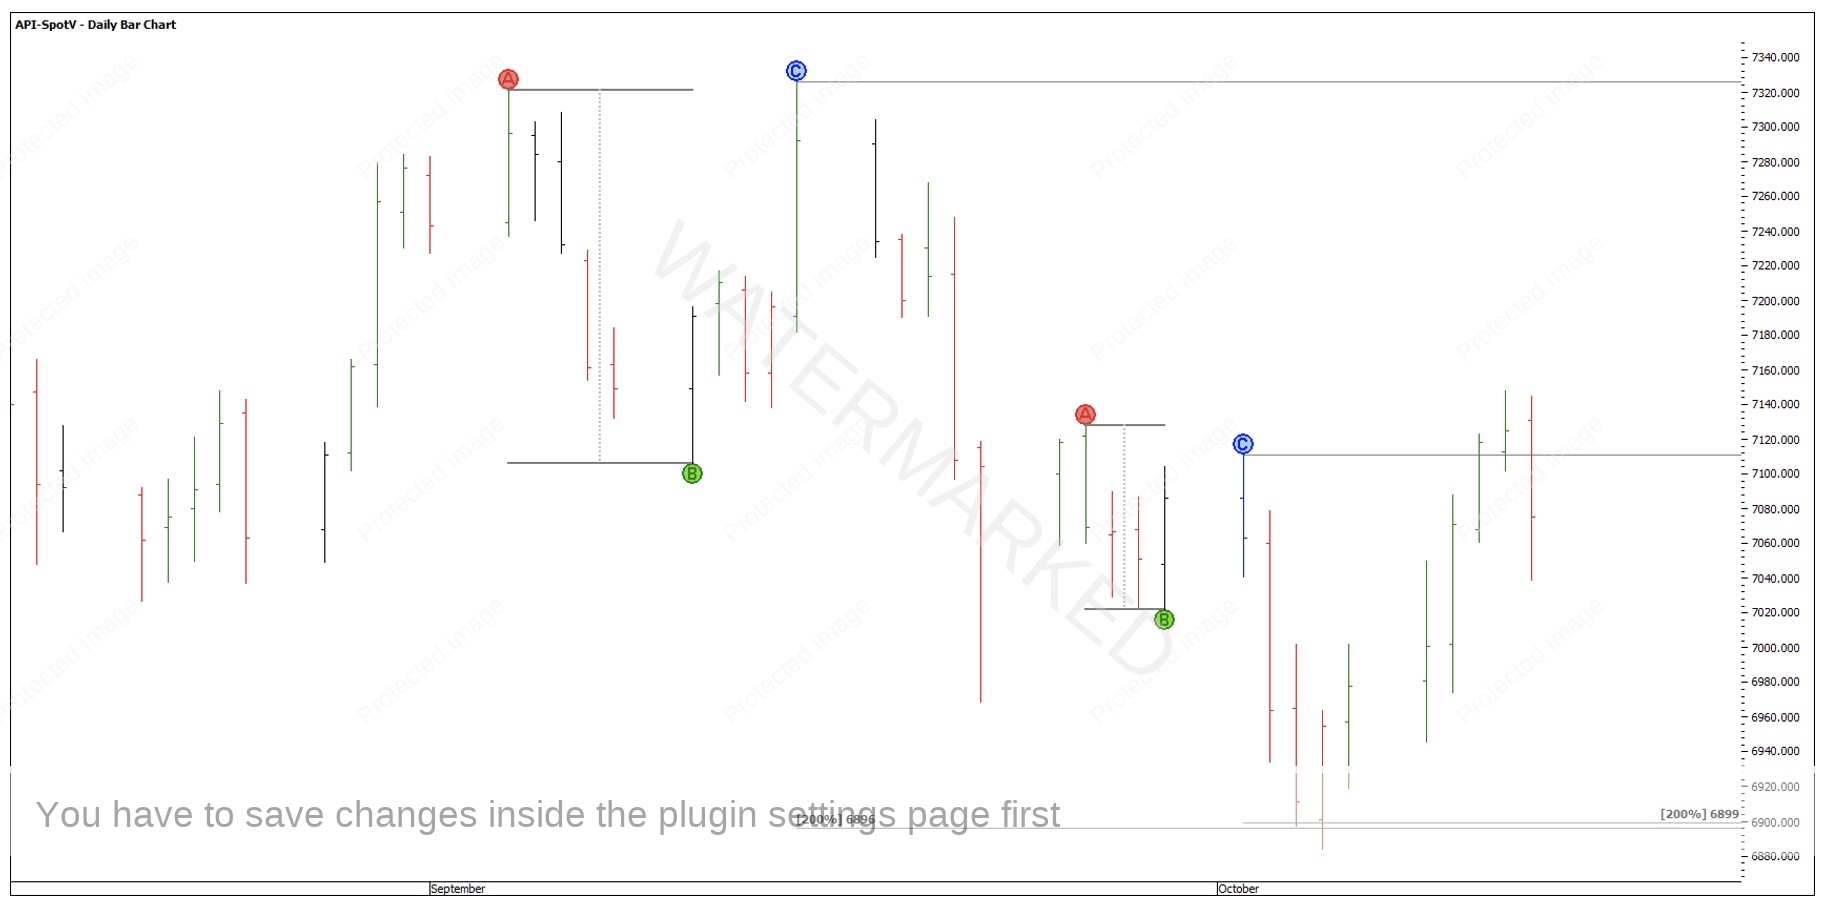
Chart 9 – 200% Exit Target
There were also tighter entries on smaller time frames for you to explore if you wished.
I have all these charts marked up by hand and find it amazing how much detail you can put into hand charts that you can’t get with software. It may take longer but I believe the rewards are worth it!
Happy Trading,
Gus Hingeley