Who’s in Control?
So who is? The bulls or the bears? Obviously the more evidence we have the better. So let’s see what can be gleaned from some detailed analysis of the Silver futures market in its current state.
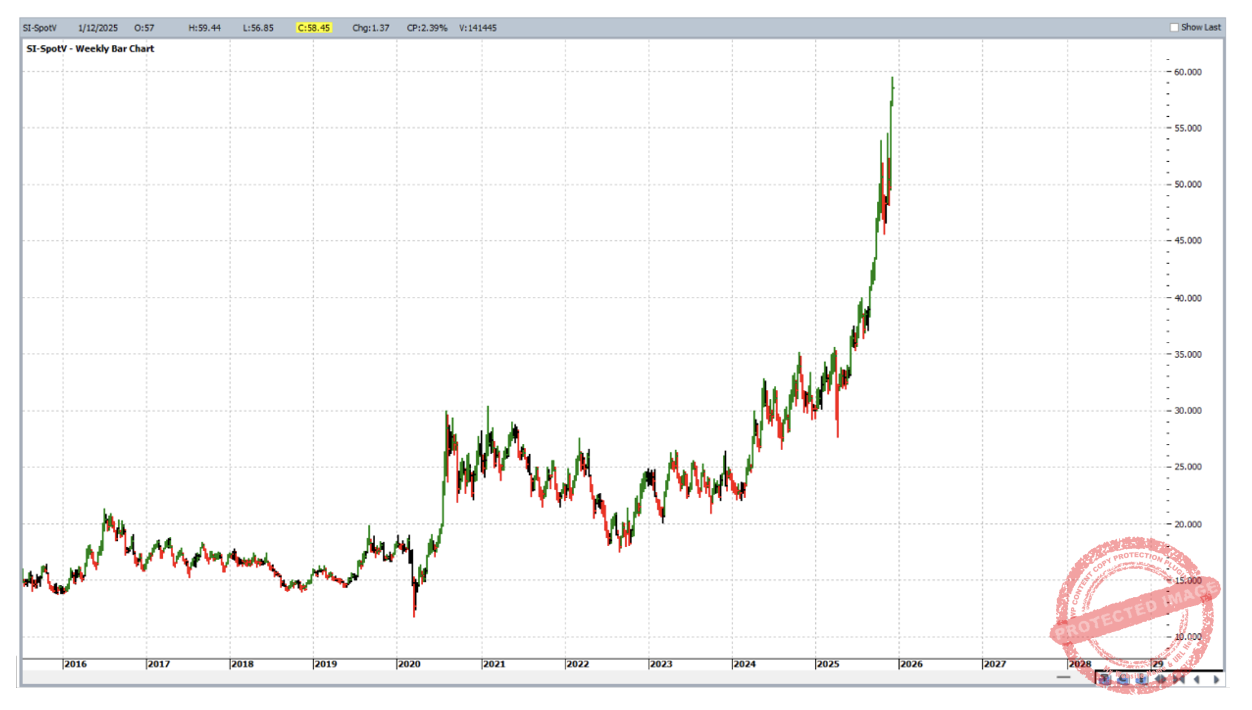
As can be seen from the chart below, Silver has had a very strong run of late. It’s currently in an up trend with average bar sizes far greater than usual – the size we normally only see when this market trades at higher price levels. Below is the weekly bar chart from ProfitSource showing Silver’s recent market action, chart symbol SI-SpotV.
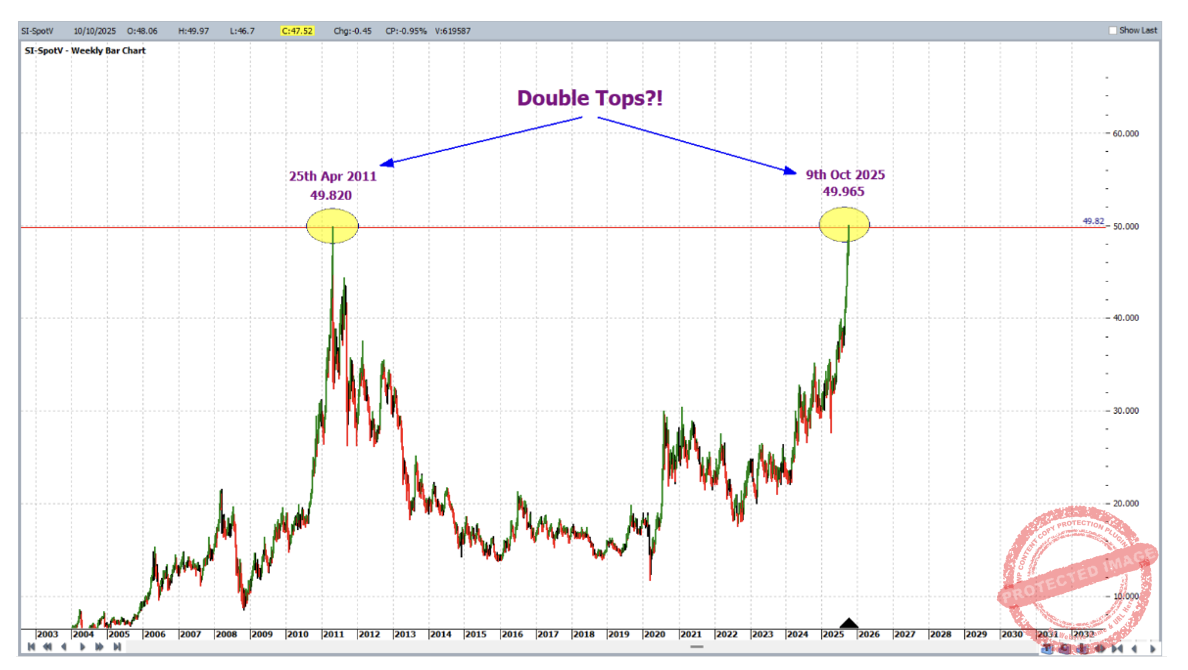
It’s one thing to look at a chart and see that the bulls are pushing a market into an up trend and trade with it. But can any further analysis add to our confidence as we do this? First of all, let’s rewind a couple of months back – to early October. As can be seen below, there was a potential double top formation – quite a major one!
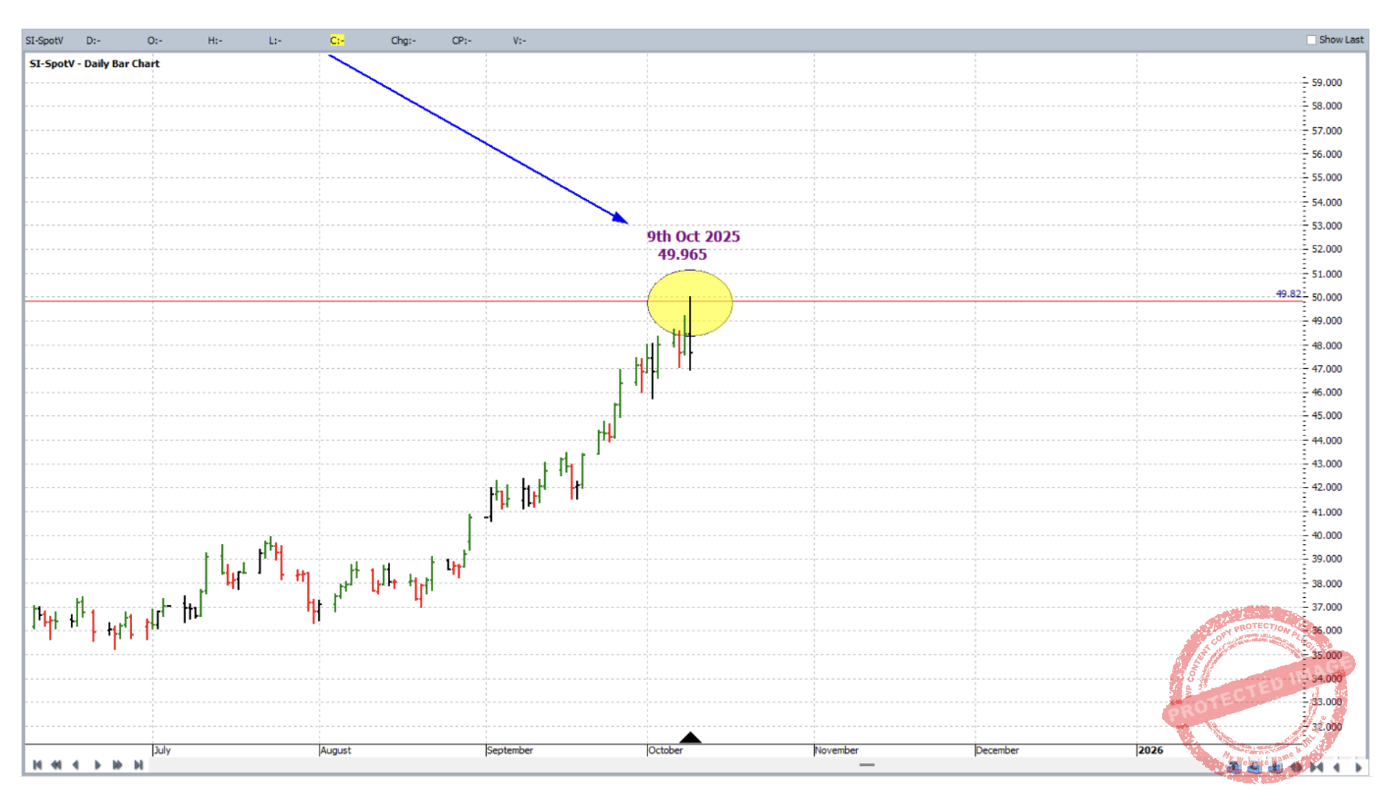
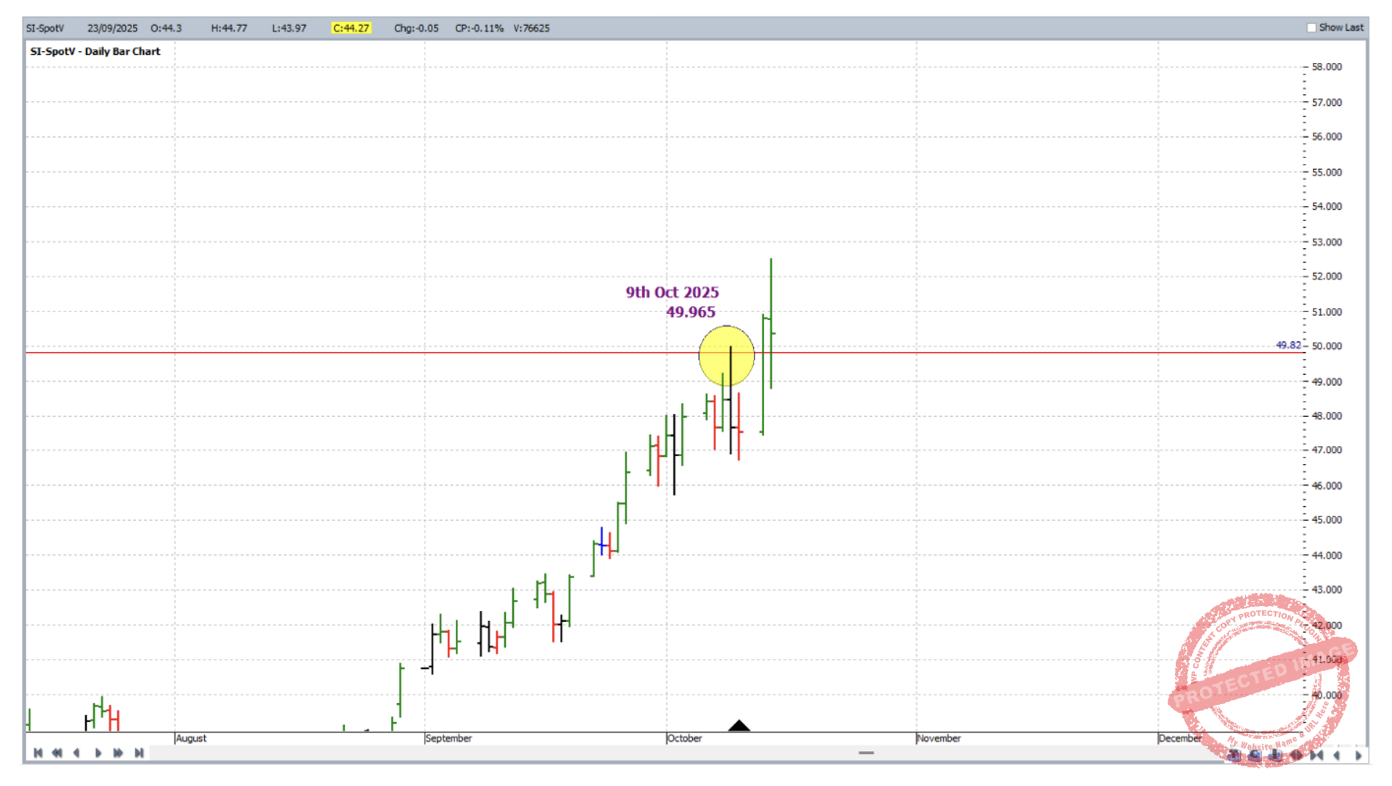
Zooming in further to 9 October 2025, there was also an outside reversal day at this potential top.
Normally we look for at least three strong reasons to call and trade a reversal in the market. But this double top formation was so significant that it as a sole factor would have definitely tempted the bears. And for a very brief window it did. After all, double top formations are a fairly general indicator, and they’re definitely known of outside of Safety in the Market. A few days later though they were humbled with the bulls quickly regaining control. So which camp should we be in?
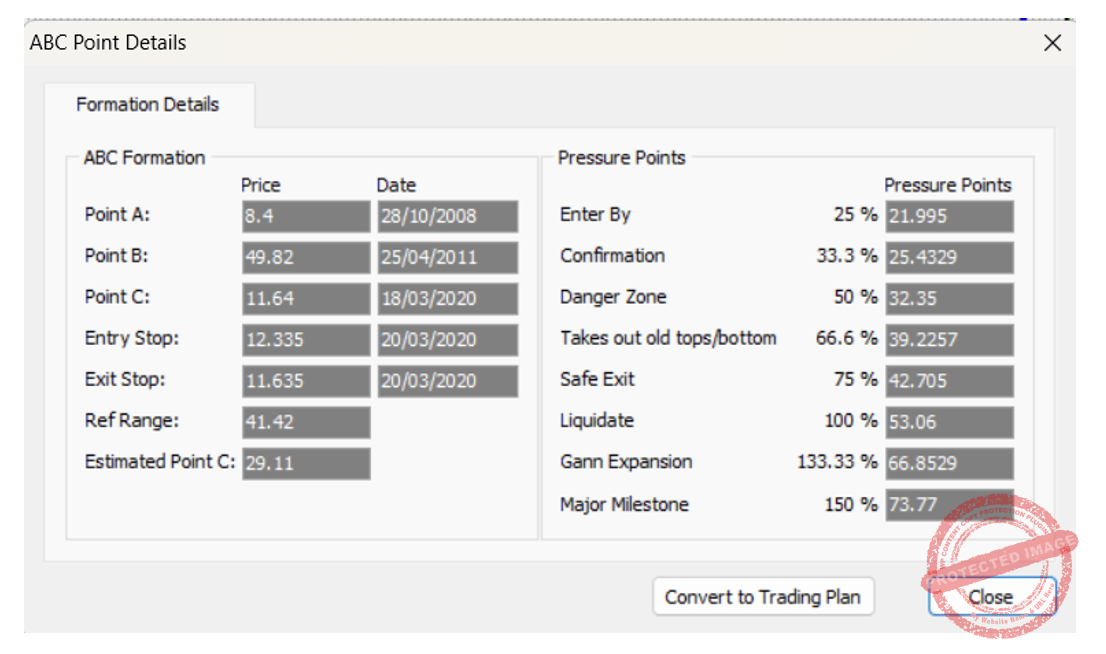
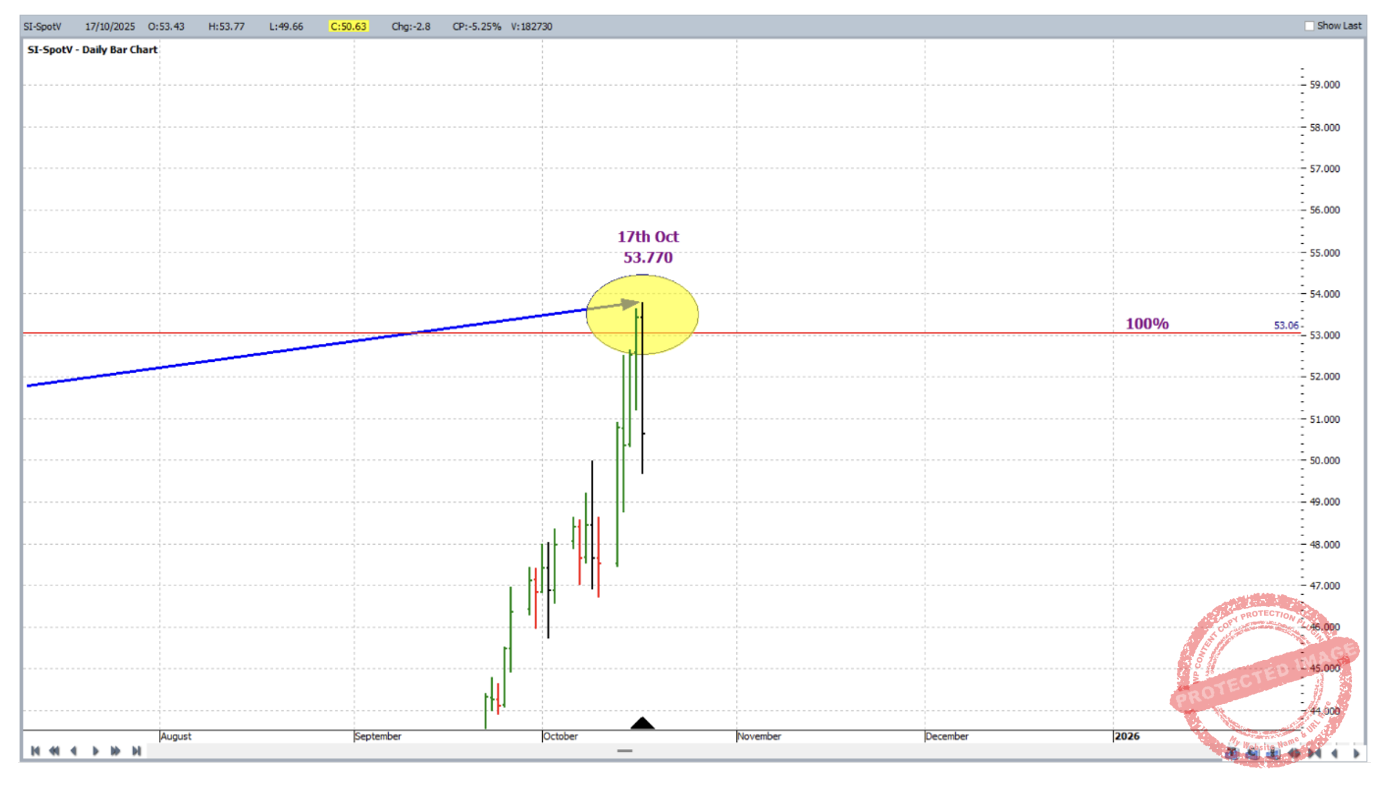
As one kept an eye on the analysis of this market, what next? From there let’s go a few more days into October. As at 17 October 2025 the market had reached 53.770 USD per troy ounce. This was a relatively small false break of the 100% milestone of a major ABC Pressure Points application. This is shown in the chart below followed by the ABC details window.
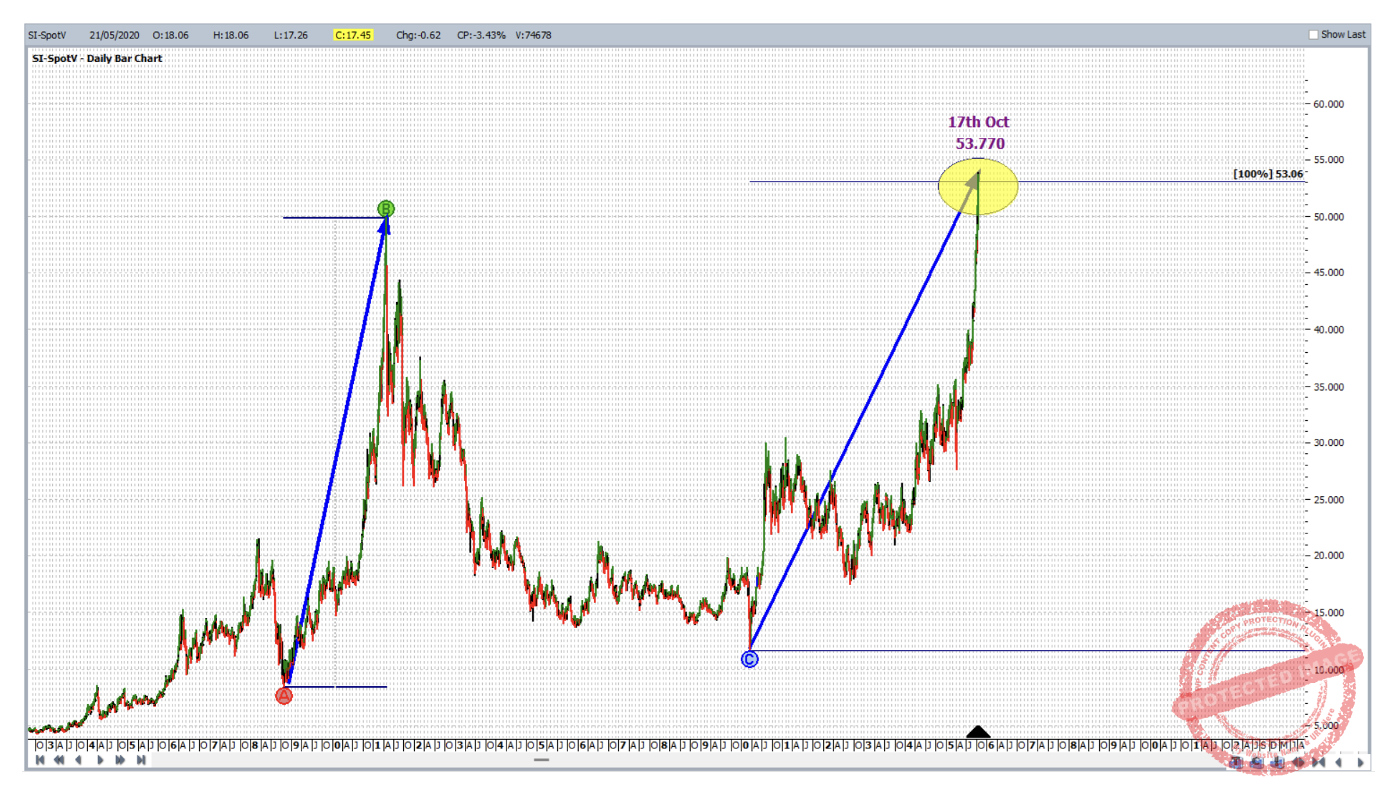
As far as Ultimate Gann Course students are concerned, if you look further back into the price history of this market, there is evidence that the chart above is part of the analysis of Sections of the Market. This would further strengthen the piece of analysis. And if you expected a reversal for one reason alone – this would be it!
Zooming in, this time we also had an outside reversal day at the resistance level.
Some bears were definitely lured in, but their glory was short lived. By mid-November the bulls had returned with a vengeance.
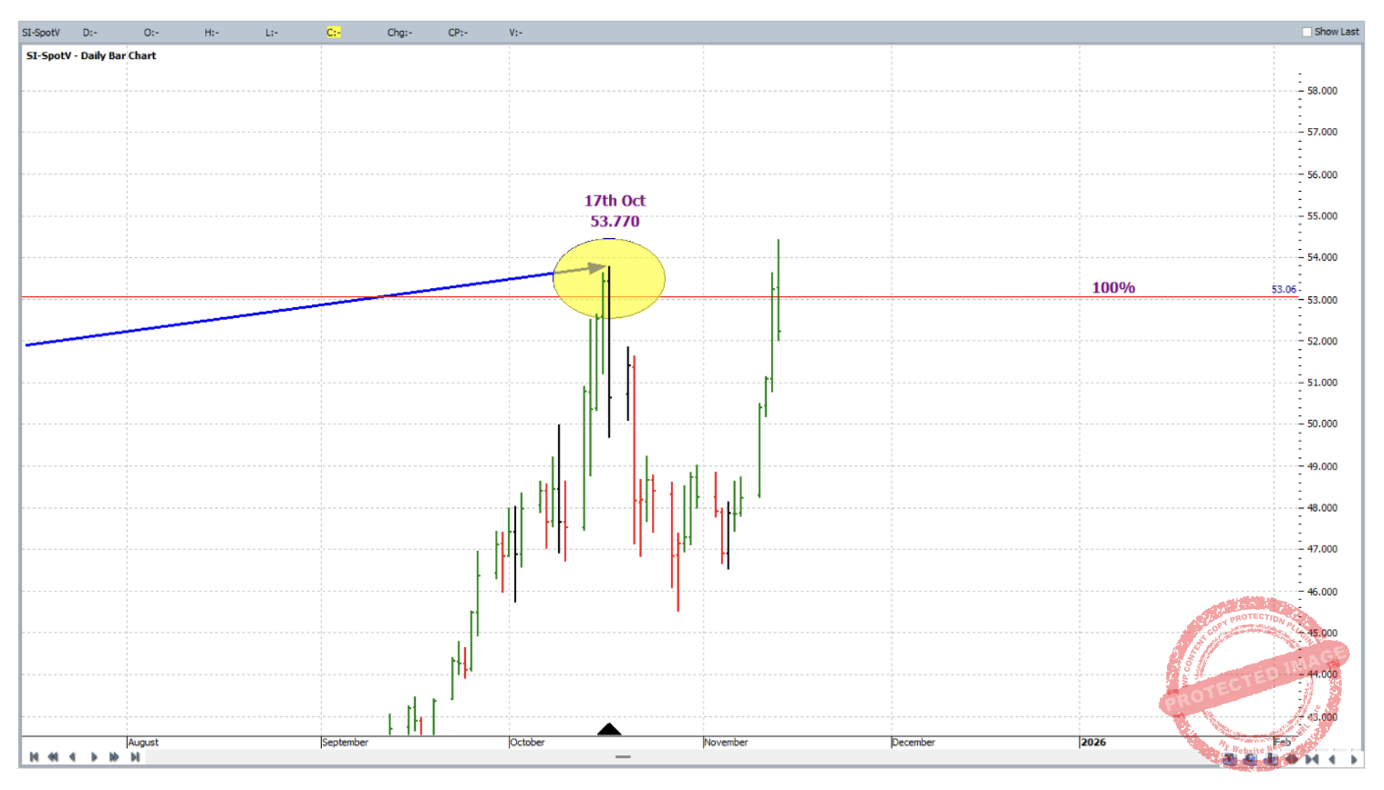
As at the time of writing, this market currently sits as shown below. It has just broken through yet another price cluster around 57 to 58; I’ll leave that one to the reader to have a go at reproducing.
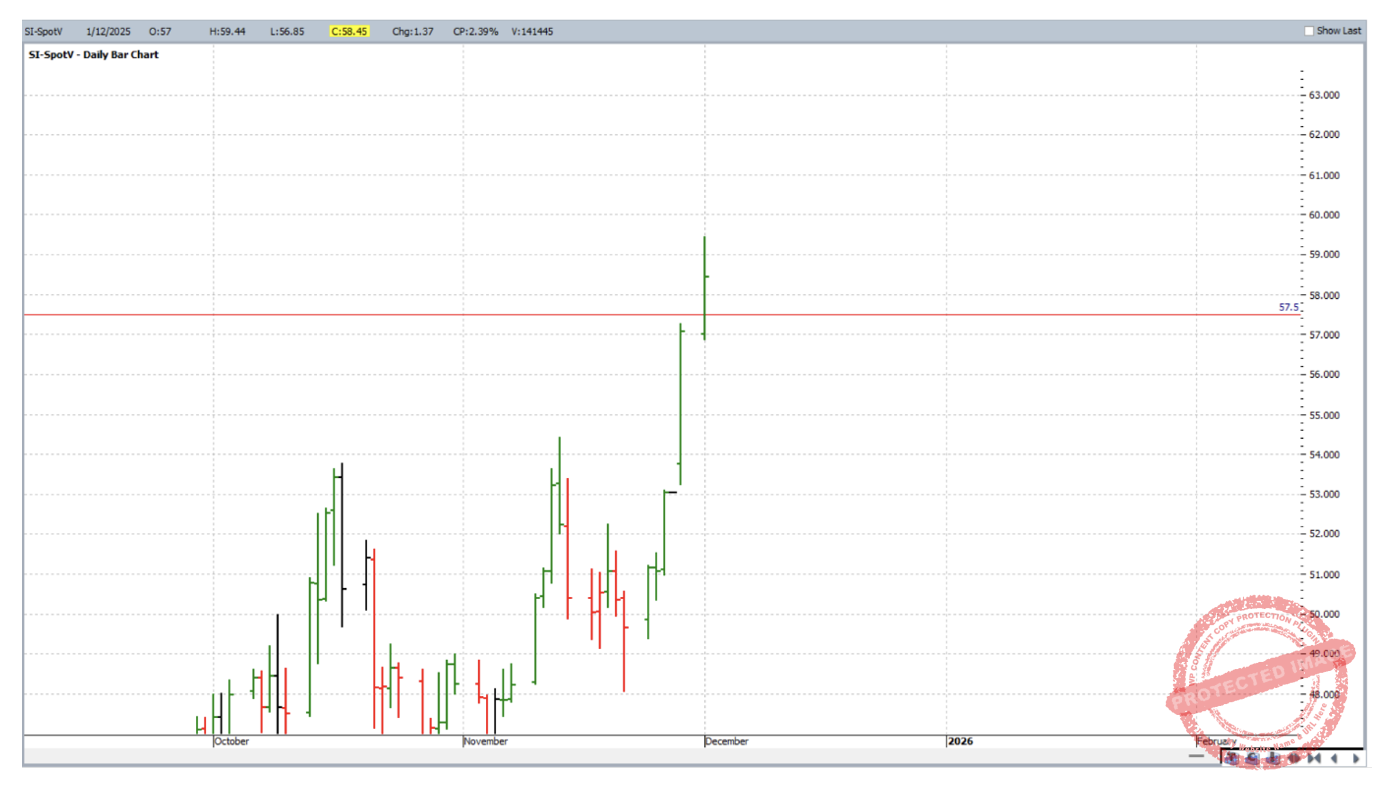
When a strong technical set up fails to put a top in the market trading at high levels, it means one thing – bulls! And plenty of them.
Work Hard, work smart.
Andrew Baraniak