Wonders Never Cease!
Imagine a time when the Internet had not been invented, mobile phones and computers were distant thoughts into the future and hand charts were the way to record financial market prices. This statement sums up the environment we would have seen WD Gann working in had we stumbled into his trading office over 100 years ago as opposed to the modern environment we now take for granted.
The same applies for us in terms of the financial markets that we now have become accustomed to trading. If we go back to Gann’s time we would have focused on physical commodities and companies that traded in physical goods and services. We are now in an environment where new trading instruments will become a more frequent proposition as technology advances and the way we view important commodities of life comes to the forefront.
If we were to ponder the future, we would ask questions around the types of assets or what we could label “commodities” that humans will value. The likelihood of super computers collecting and tracking “big data” with its ability to map and track our behaviour will be a reality, so in turn, if we follow history, mankind will place a value on it. We can likely pool this cyber commodity with the pressing need for water, carbon capture and mitigation and the unpredictability of weather and we could see several futures contracts rolled out to offset risk for some and cause others to speculate.
For some, discussing this type of future may seem further away than what we can anticipate at the moment, but if we focus on the present, we already have a new trading instrument that has arrived that would have been impossible to imagine in Gann’s day. We now have a global focus on the cryptocurrency markets and the associated blockchain technology. This event 10 years ago was most likely an outlier in most people’s minds including mine. So, with that in mind we can jump into some recent activity on Bitcoin and see how in 2020, Gann’s rules are working equally as well on a market he would have not been able to envisage to bank tradeable profits.
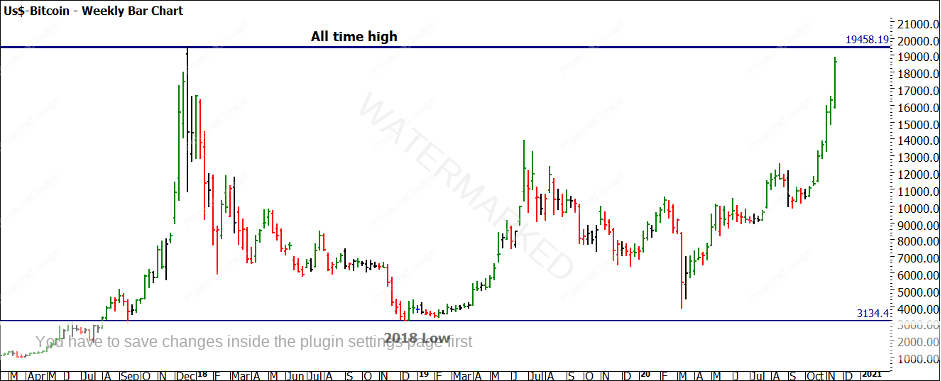
To be clear I was not an early adopter of the Bitcoin world but given 2020 has been an odd year for us all, we all have had to challenge our beliefs. I have several associates who have been strong advocates of the future of crypto from the early days, however, my interest was garnered after the collapse of 2017. The price of bitcoin moved from approximately $20,000 down to $3,000. A massive decline in anyone’s books, for me, the test was could and how it would recover to see if it was a serious market.
Chart 1 shows the last 5 years and the rapid expansions and declines in price.
Chart 1 – Weekly Bar Chart Bitcoin – USD
As we have discussed, in 2020 some markets did not trend as well as we may have liked but this market has not been the case. There could be a hundred fundamental reasons why this market is moving with momentum but if you remove the name tag, we can treat it as a simple chart.
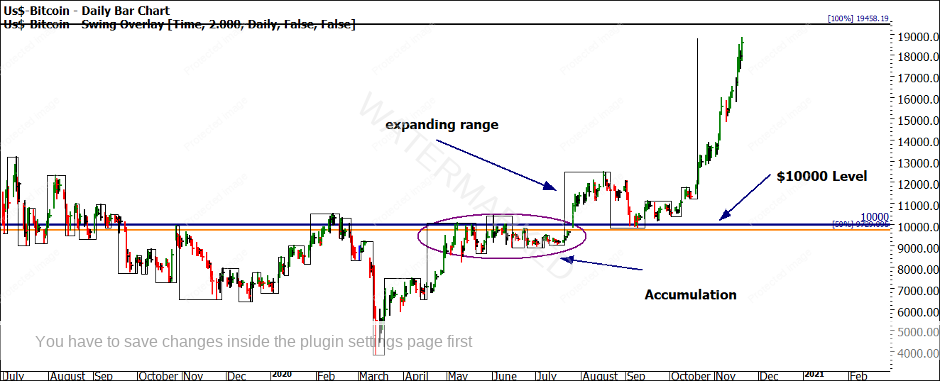
We know the value of the 50% area, so my interest was heightened when an old level of resistance was broken. In Chart 2 We see the All-Time High used as a Highs Resistance Card and with the 50% area providing previous levels of support and resistance. The orange line represents half the All-Time High so clearly, any bullish activity to higher prices would need to show strength above that level. Leading into the breakout above the psychological $10,000 level we had several months of sideways accumulation where we could not see a higher bottom formed on the two-day swing chart.
Chart 2 – Daily Bar Chart Bitcoin – USD
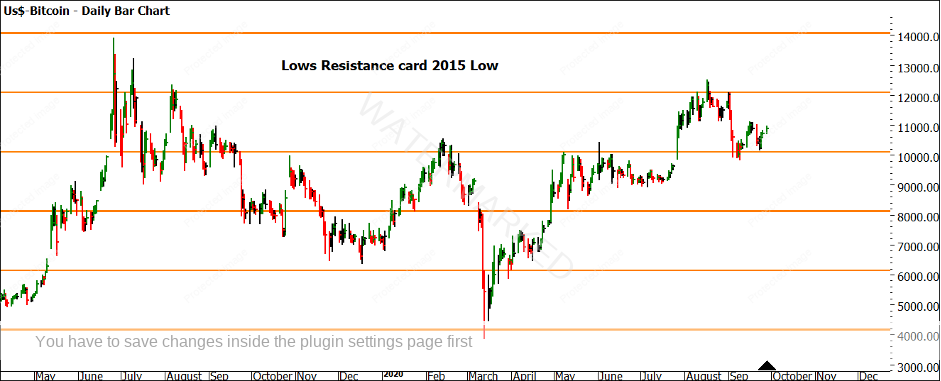
If we go back to a lesson from Gann’s early work of Price Forecasting where we apply a Lows Resistance Card to the low of 2015, we can see on numerous occasions where these lines have acted as support and resistance using straight 100% multiples. If we focus around September, we have seen a first higher swing bottom form above 50% of the All-Time High and sitting on the old tops of February and June 2020 (that happen to align with the lows card as well.)
Chart 3 – Daily Bar Chart Bitcoin – USD
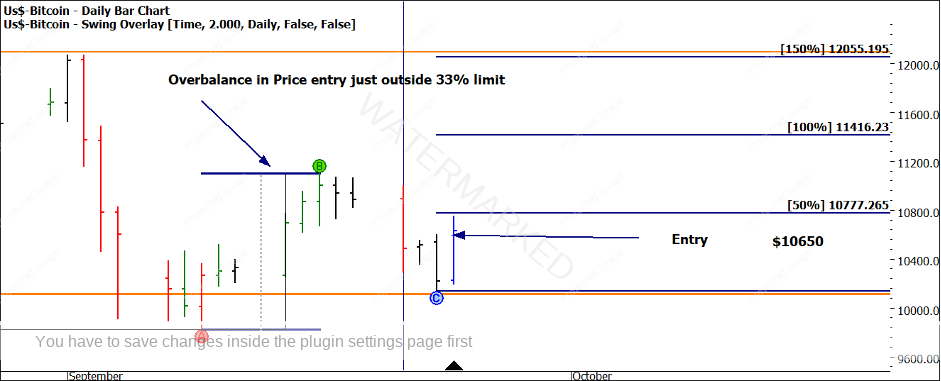
Chart 4 details the entry where we had several small picture elements going the right way. This constructed ABC setup meets the criteria of an overbalance in price trade as Point B is not above the previous tops. These were the types of swing patterns David would combine with time and price pressure. There was Time by Degrees harmony you could examine here as well.
Chart 4 – Daily Bar Chart Bitcoin – USD
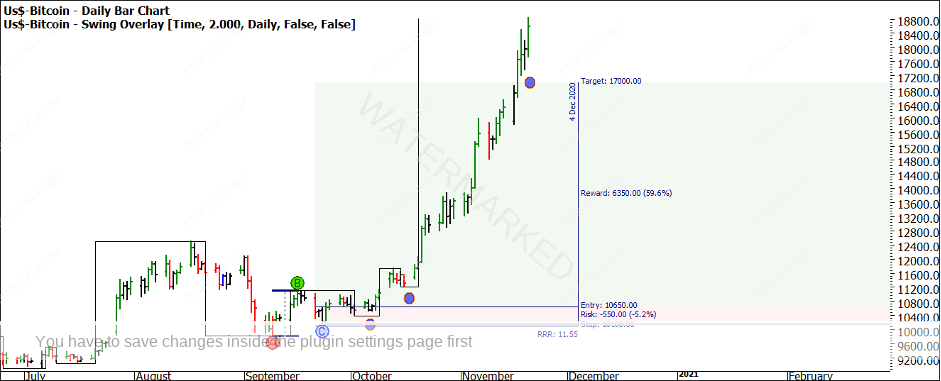
Managing trade risk and position sizing is always a critical aspect for traders. Let us suggest that a simple trailing stop behind swing bottoms on a 2-day chart will suffice for the exercise. The magnitude of the price movement has been extraordinarily strong with limited pullbacks. Hence the two-day swing chart now lags the price gains considerably so a more modest trailing stop would be employed.
Chart 5 – Daily Bar Chart Bitcoin – USD
As It currently stands the reward to risk is sitting at approximately 11 to 1 or $6,350 profit for every $550 risk on a zero-leverage basis. All from combining lessons in Technical Analysis written well before cryptocurrency was imagined.
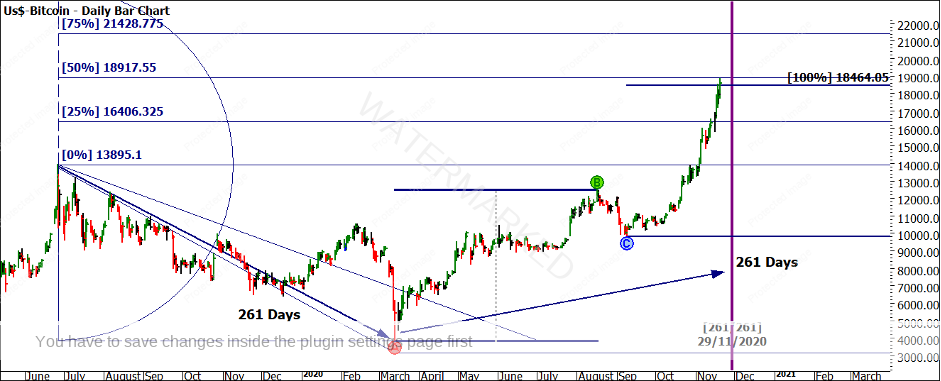
Chart 6 will leave you with some food for thought as we see the potential resistance to this move. The current run-up from the low is 252 days. The previous bear move was 261 days, and given that we have run 100% of the previous range and Tubbs 2 Point Swing Rule shows we have travelled 50% of the bearish range above the old high, we may be wise to ratchet up the stops. There may be more upside to come on Bitcoin but after taking a chunk like this out of the market it is best not to be too greedy.
Chart 6 – Daily Bar Chart Bitcoin – USD
Good Trading
Aaron Lynch
