2024 – Time to Get Started
We are on the cusp of the completion of another calendar year and a typical message I share for you is to get planning for next year in terms of goals, routines, and markets. Outside of time pressures, there is no reason we cannot begin our roadmap exercises for 2024, I found the ones I put together at the end of 2023 held me in good stead and I found my market challenges were replaced by normal life hurdles that we all face. I certainly don’t regret, with the power of hindsight, the work that I invested in my trading at this time last year.
We will continue to track the fortunes of Crude Oil. As many would know, this market represents now a 20-year association as my chosen market given its liquidity, volumes, and lack of overnight gaps. I hope you have engaged with this market in theory or practice, as it has been an orderly market with two major moves, a simple long and short trend, that gave us the opportunity to trade two solid moves. The work I had put in for 2023 was to review what months in the years ending in 3 had common months for changes in trend. The months of March, September and December showed areas to watch and of course this aligns with our seasonal time so this can make it easier to look for anchors.
There is the anchor of both 1983 and 1993 in the month of December that could also offer one more opportunity for a tradeable change in trend, where we can extract the larger risk and reward launching pads. If we now jump back to last month, I had put some analysis into the way the November seasonal date demonstrated harmony and a possible change in trend.
Chart 1 updates us on the outcome. The price action ran into the 8th and showed a reaction and then gave us 1 day where the lows were broken. Given the price action has moved sideways we could have seen what will reflect as a false break.
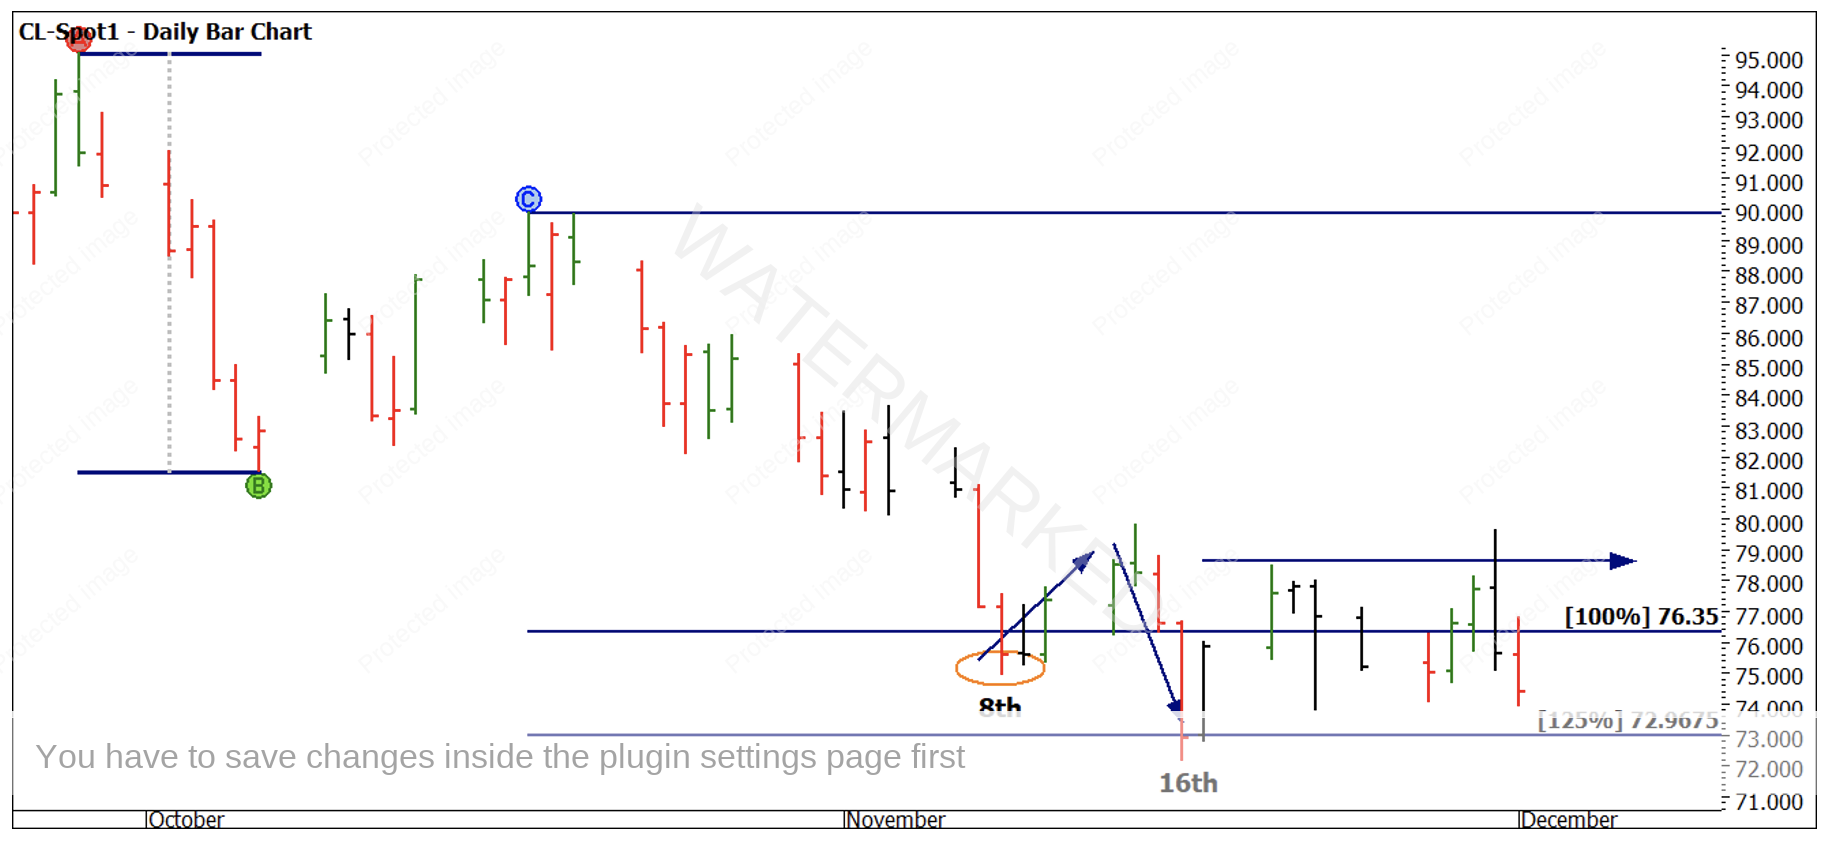
Chart 1 – Daily Bar Chart CL-Spot1
Given how active Crude Oil becomes in the northern hemisphere winter as heating needs increase (Heating Oil is derived from Crude Oil) we often see the severity of the winter months driving prices for Crude Oil. On the technical side, Chart 2 is one that takes a lot of patience to see come to fruition and it is providing some big picture blocks for the coming months to drive some movement.
The measure of 180 be it minutes, hours, degrees or even years is used regularly in our studies. Chart 2 shows an example of 180 weeks working this year when measuring from major turning points.
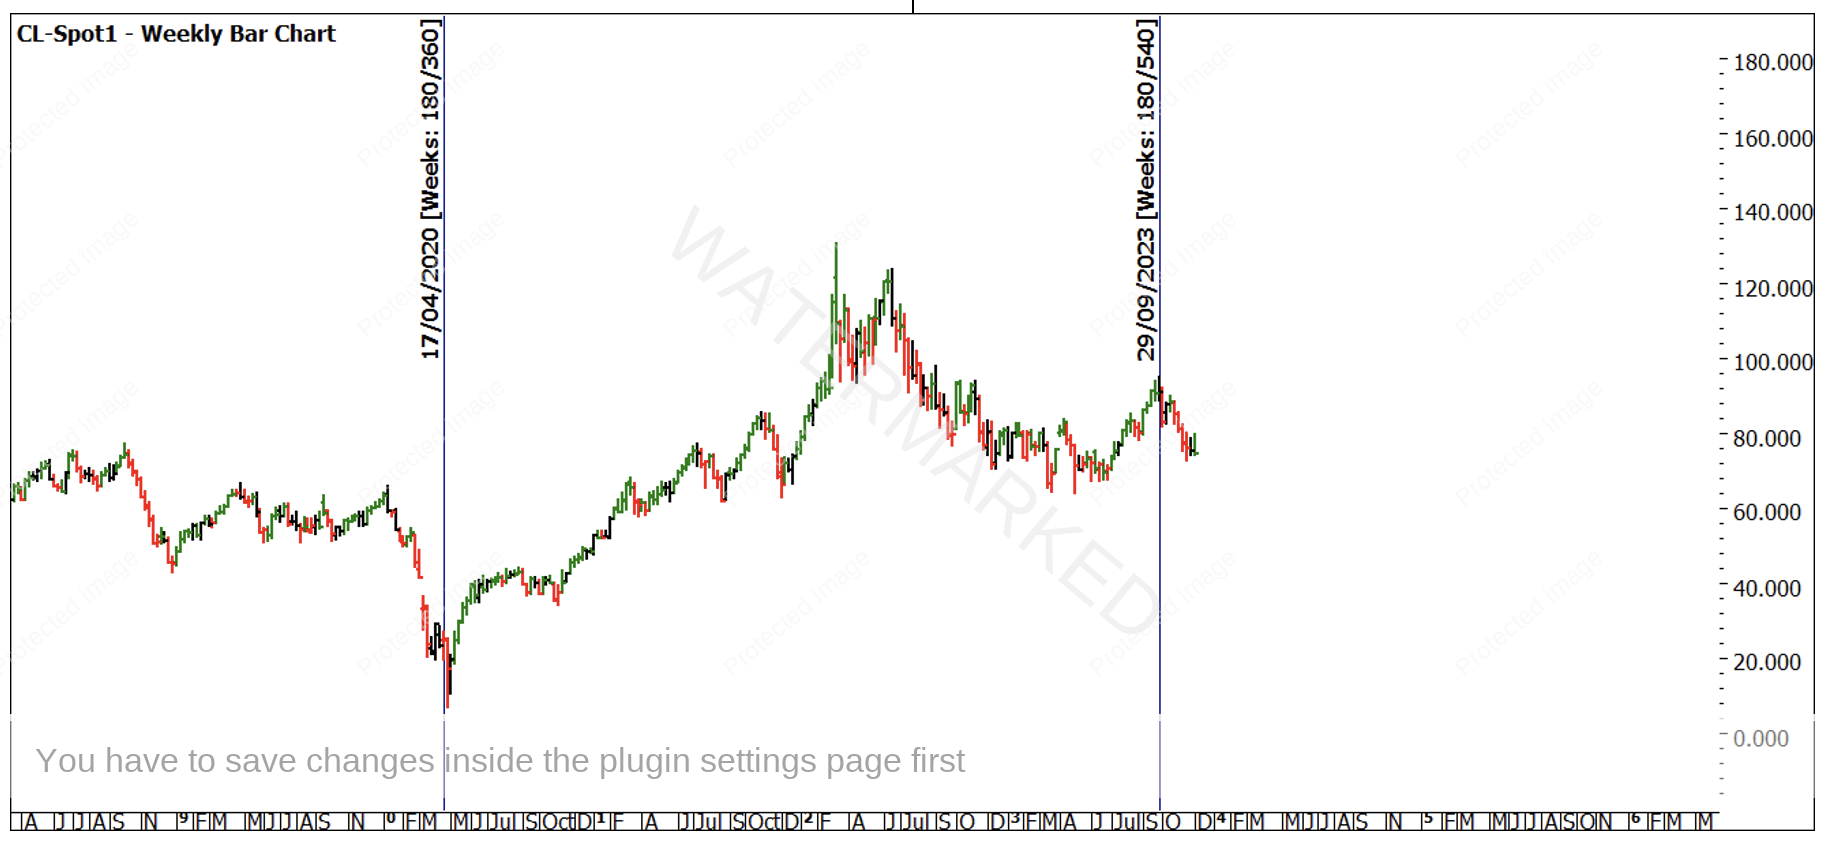
Chart 2 – Weekly Bar Chart CL-Spot1
I called the turn in 2008 for the 19th of December and watched it drop in to the low and then out the other way so it’s easy for me to anchor to this part of the market as a lived experience. Chart 3 shows we are approaching 180 months or 15 years from the GFC low of $9.75. Given the market will do just enough to mug you, for the reasons we have been discussing in the Platinum newsletter, I had some cause to think November could be aligned with this cycle, remember a 1% error of 180 months is still over a month or approximately 54 days over that many years. Of course, I am not suggesting we can apply a 54-day window to align dates, but that is why we use the smaller picture to lock in with the big.
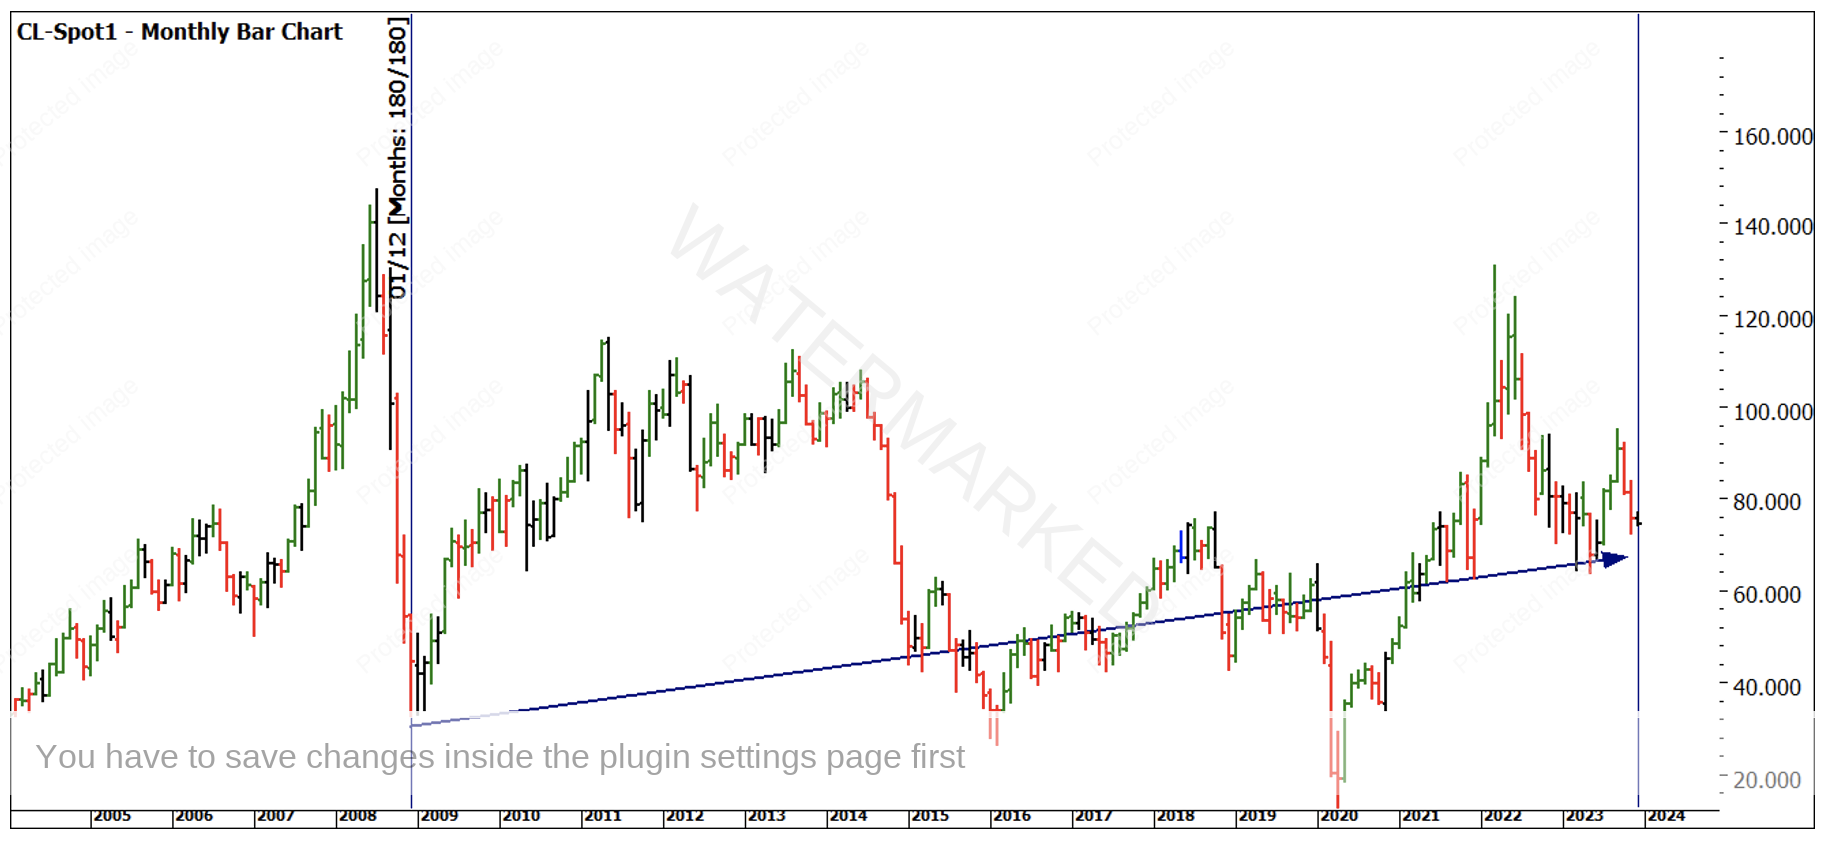
Chart 3 – Monthly Bar Chart CL-Spot1
Since November is now in the ‘journal of incorrect analysis’ on my part, I now must be open to some of the other bigger picture aspects that we can measure. My focus is now also around ensuring any entries meet the criteria of my trading plan and of course using the swing chart as my primary tool for executing a trade. There is little to be gained from attempting to chase the turns as we could be seeing this market shift to a new rhythm that does not align with the ones I am following.
You should take a good look at the swing charts, especially the 2-day swing ranges, there are repeating ranges both to the upside and downside and not suggesting much as of yet in terms of the next move.
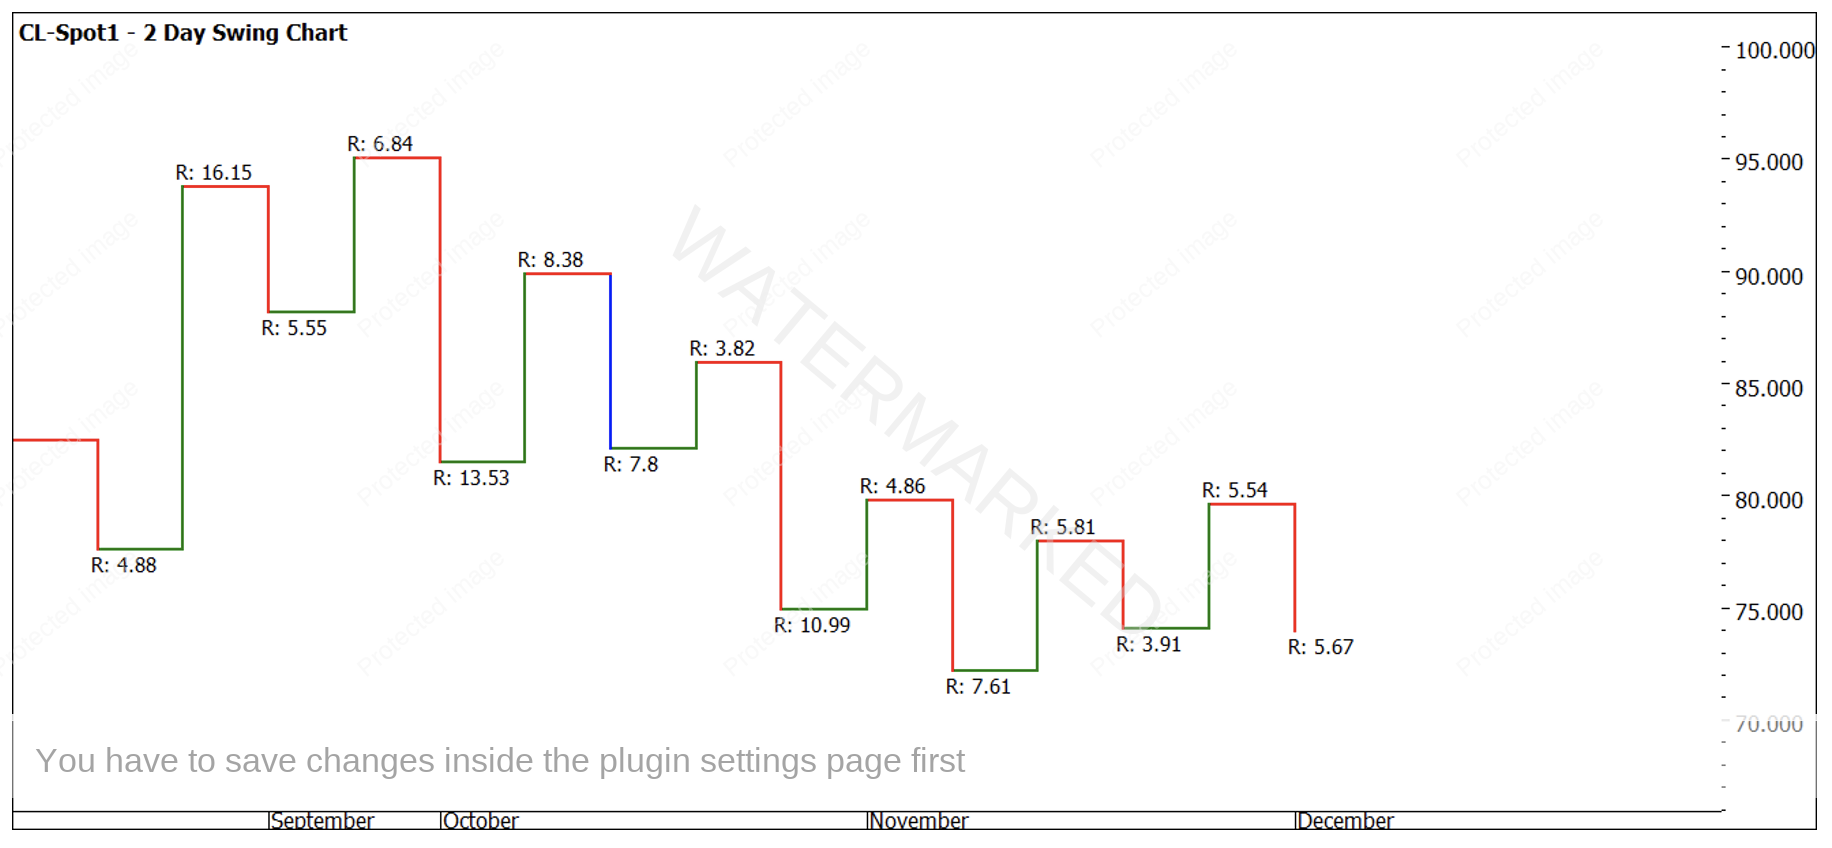
Chart 4 – 2 Day Swing Chart CL-Spot1
From an overall price perspective, we can see in Chart 5 how the All Time High price of $147.27 is acting as a highs square (resistance card) at our current price point. 50% of the high suggests the $73.64 level could be an important one to watch.
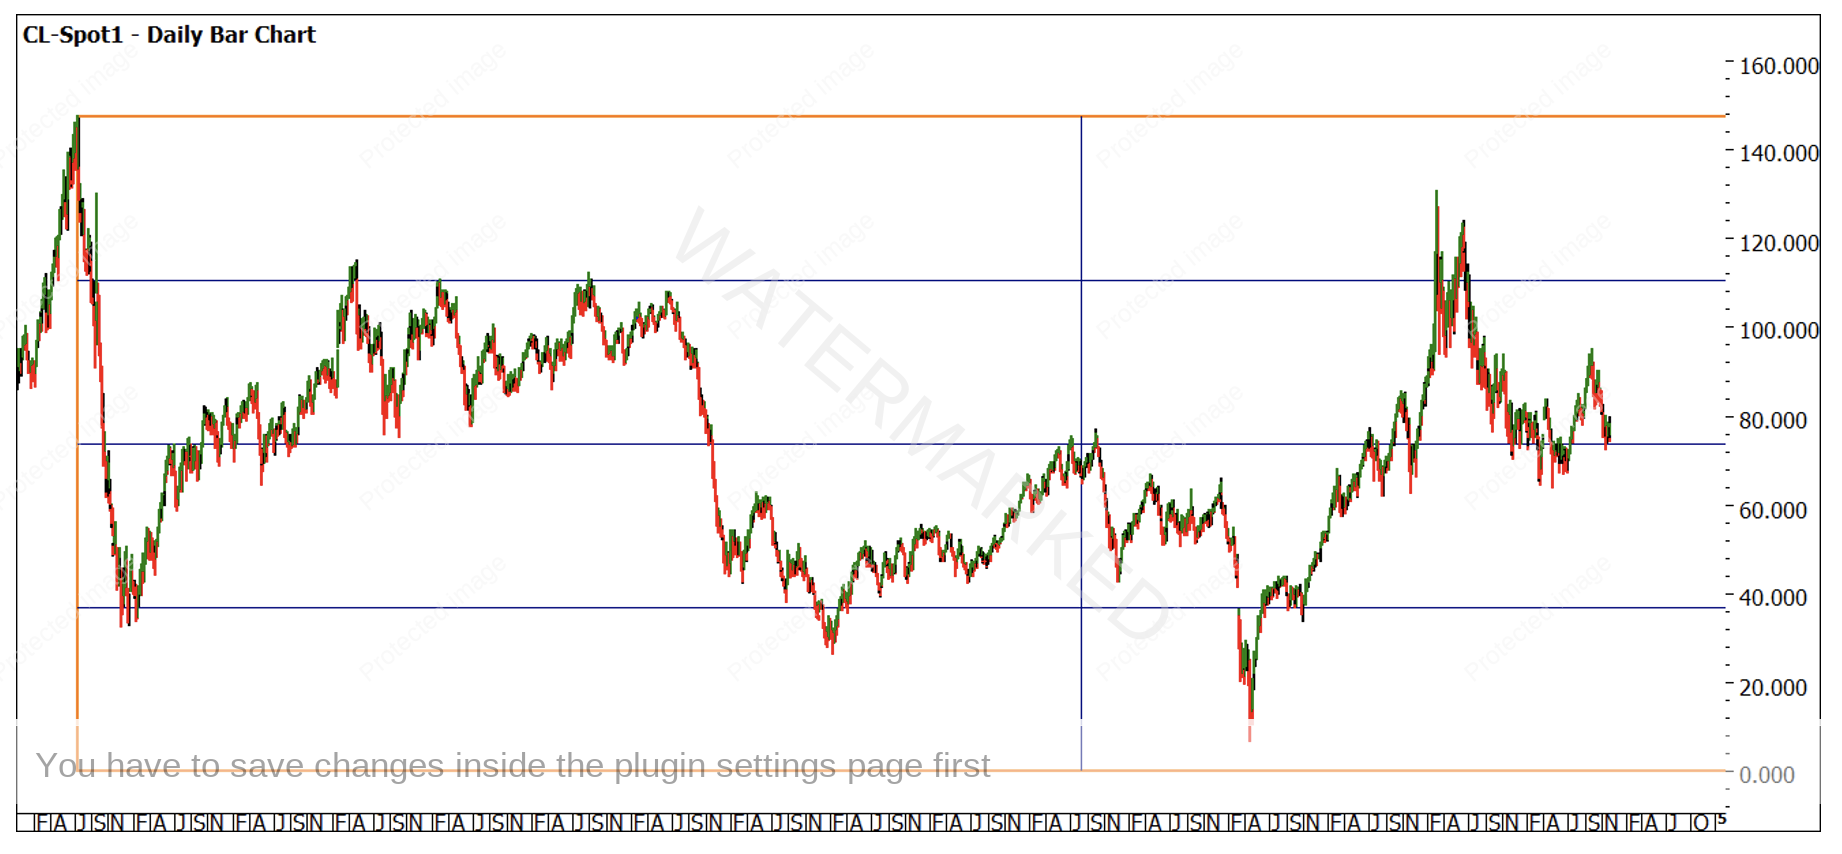
Chart 5– Daily Bar Chart CL-Spot1
Some patience and stalking of this market may pay some dividends in the month of December, which can be hard due to the festive season.
On that note I wish you and your families a safe and happy Christmas and successful 2024.
Aaron Lynch