Natural Gas – Back on the Radar?
Last year for the March Platinum newsletter, I wrote an article on Natural Gas titled, ‘How Low Can Gas Go’?
In that I identified the makings of a price cluster between 1.35 and 1.42. This cluster has taken a while to come to conclusion, at the same time it hasn’t taken much energy or time to keep an eye on it.
Since then, this market has given us another price cluster to watch for which is starting to take shape and looks stronger than the original cluster from last year. This is one benefit of big picture clusters; you watch things develop over a long period of time and look for added confirmation along the way.
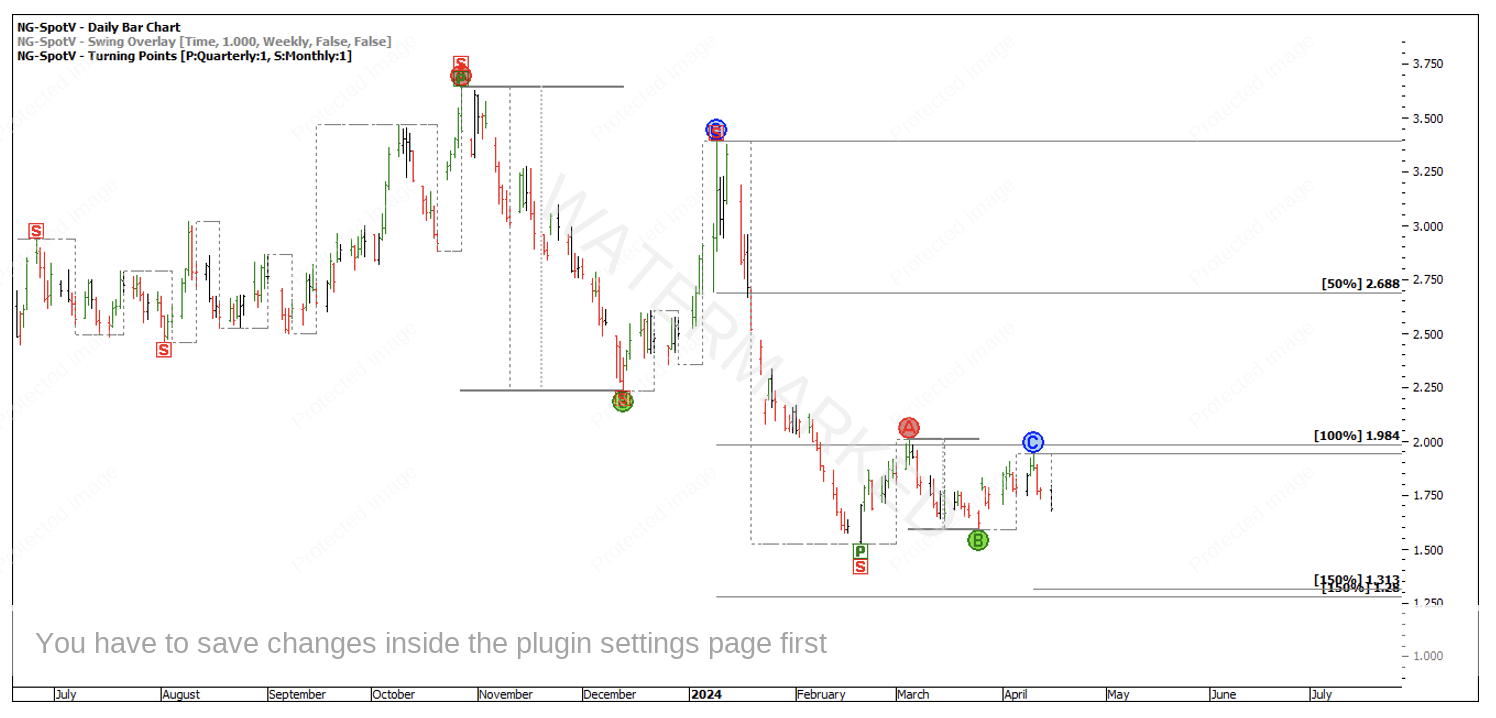
Chart 1 – Natural Gas Price Cluster
This price cluster has two, 150% milestones that sit at $1.28 and $1.30, which would be a false break of previous major lows and would be close to the yearly low in January 1995 of $1.25.
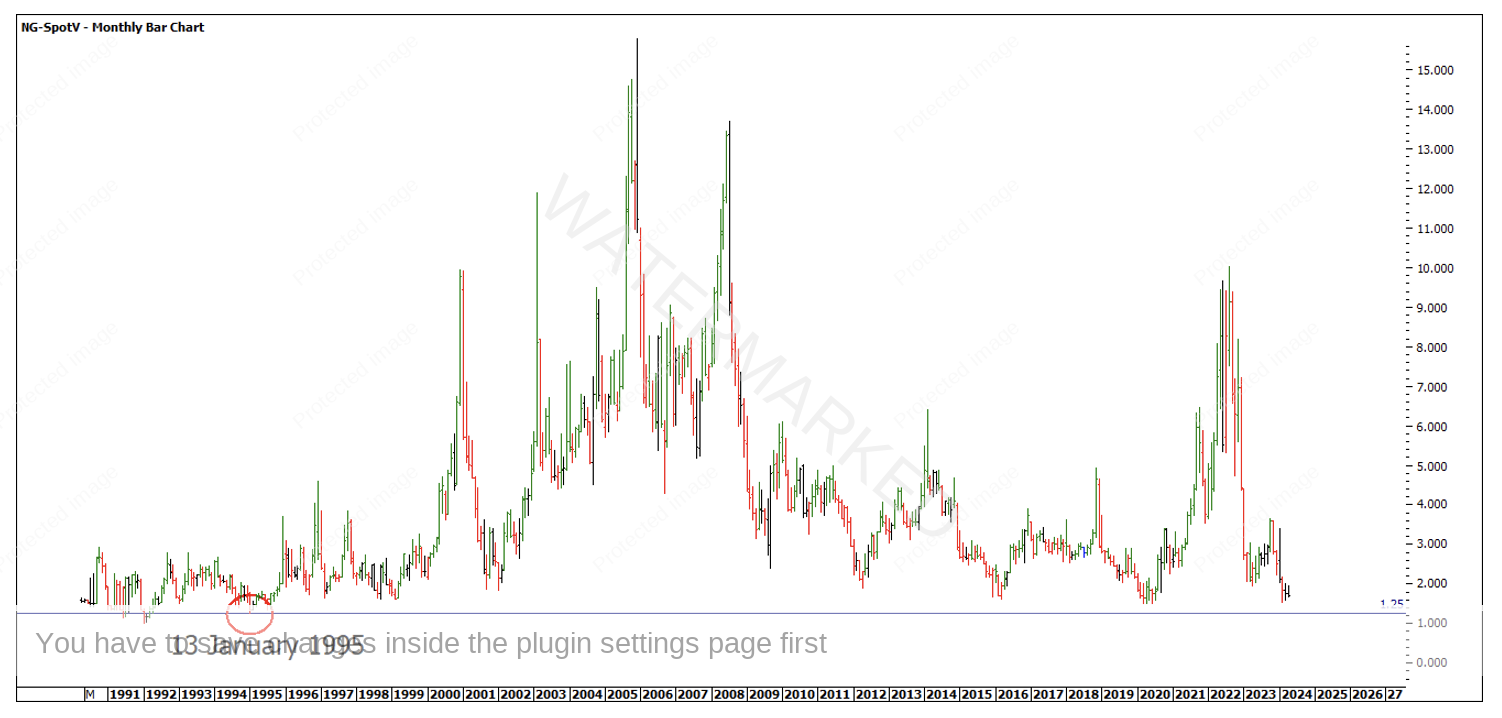
Chart 2 – Natural Gas Low of 1995
There is also a very major highs resistance level approaching at the12.5% milestone at $1.25. W.D. Gann says these levels are very important to watch when time cycles run out. You can also see that the 50% of the high called the first major low in the market after the high was made.
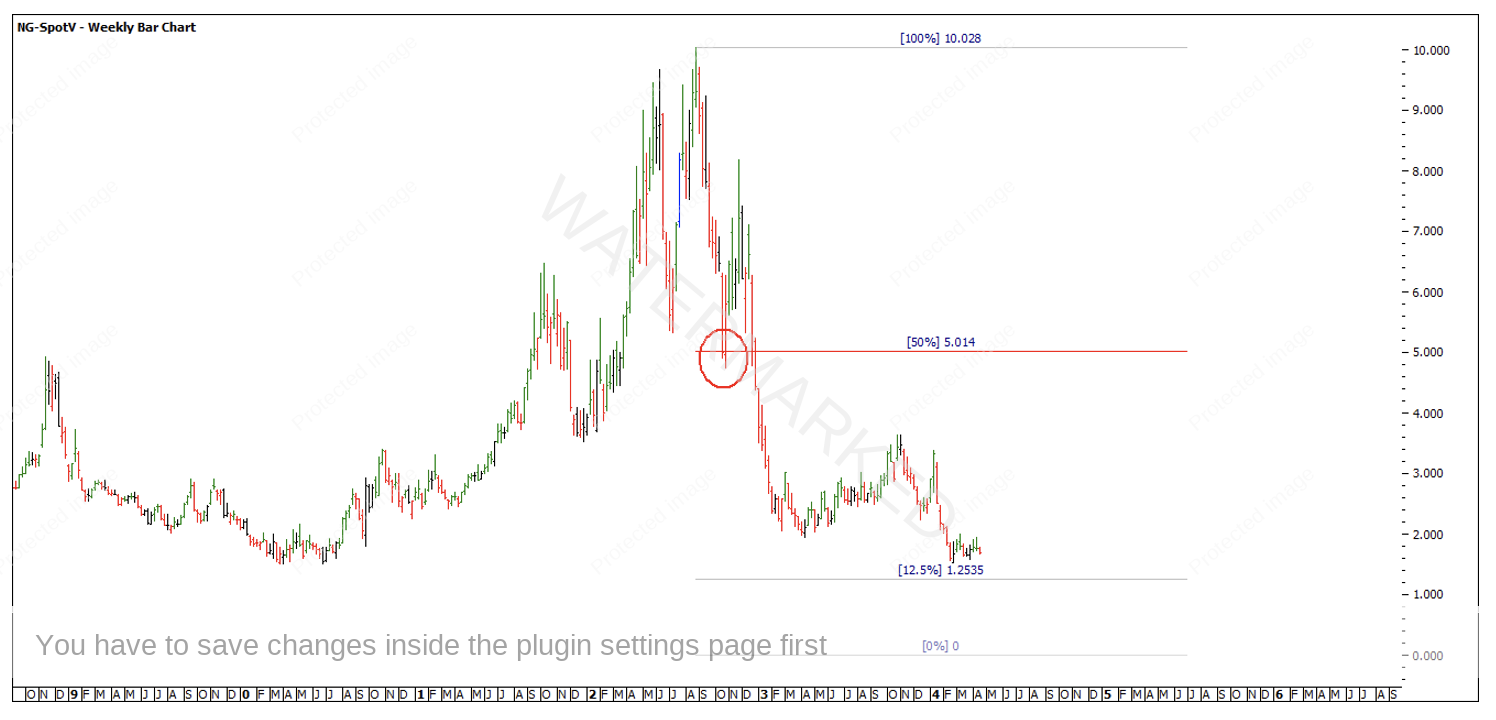
Chart 3 – Natural Gas All Time Highs Resistance Card
If we look at some balancing time or large repeating time frames, there are a number of major low to low time frames to look at and project forward. As you can see below, there is already a large difference between these low to lows and they are not a technique I would be using at this stage to look for an exact date. However, it does give me another piece of evidence that if a major low is formed in the next couple of months, then it’s in the ballpark.
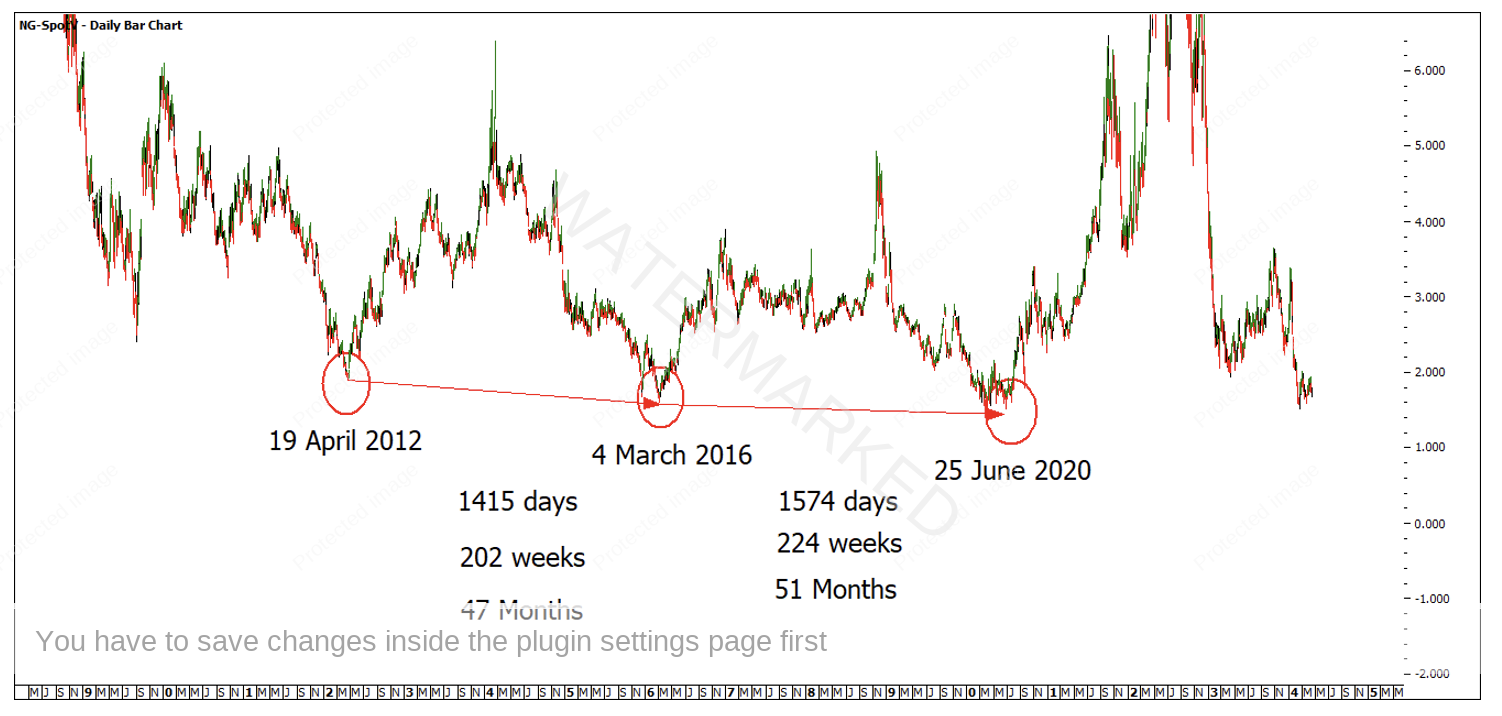
Chart 4 – Major Low to Low Time Frames
Your next step could be to start looking at which months of the year yearly lows are made. This will show you that certain months of the year have a high probability of turns. You can also add in some master time cycle work to try to identify dates for potential lows according to the time cycles.
Now that we have the bigger picture work underway, I feel it’s worth looking at the more recent market action to see when in the month this market makes its turns. As you can see below there are a few possibilities.
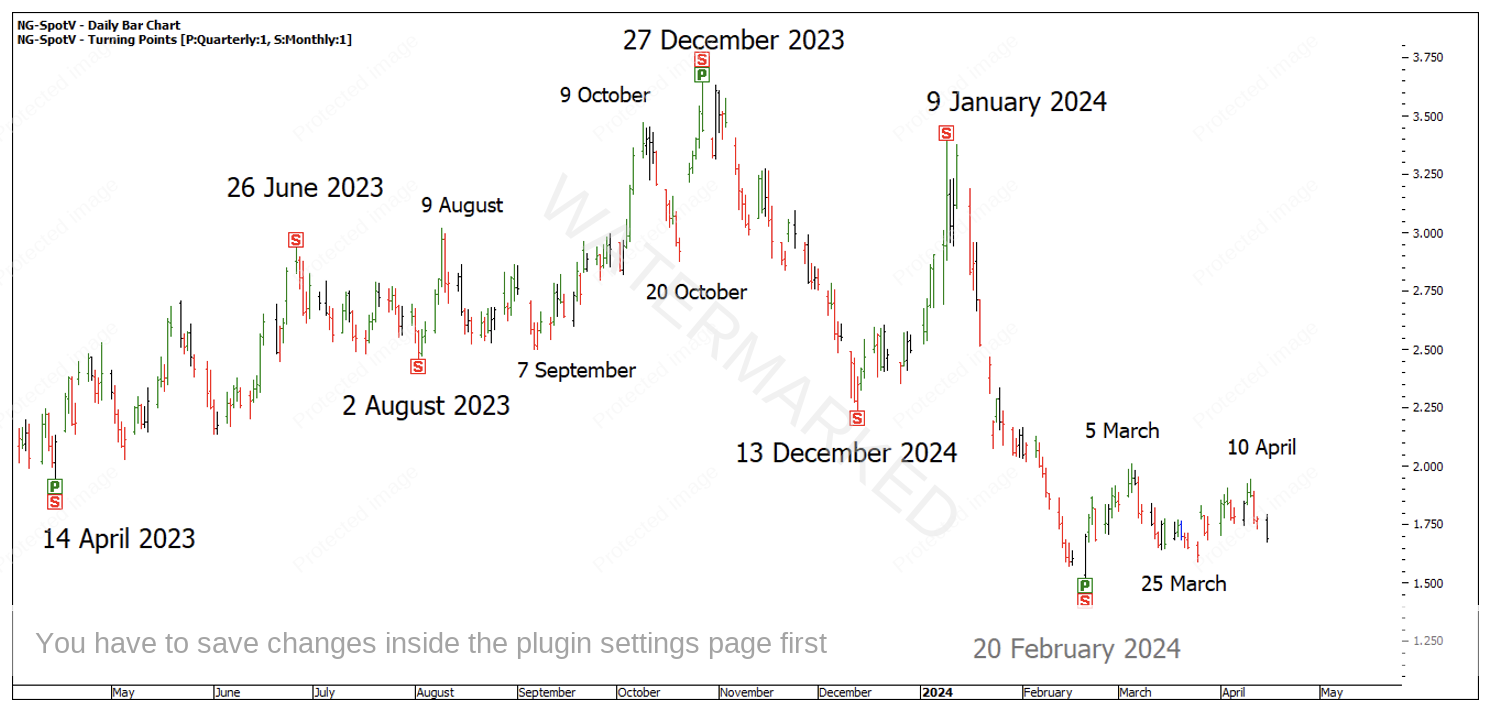
Chart 5 – Times of the Month Turns
If you start measuring between the turns, I can see that 120 degrees called the 20 February 2024 low. 120 degrees has also called the 10 April 2024 weekly swing high. 10 April high was also a 1 year anniversary from the 14 April 2023 yearly swing low and 90 degrees from the 9 January 2024 monthly swing high.
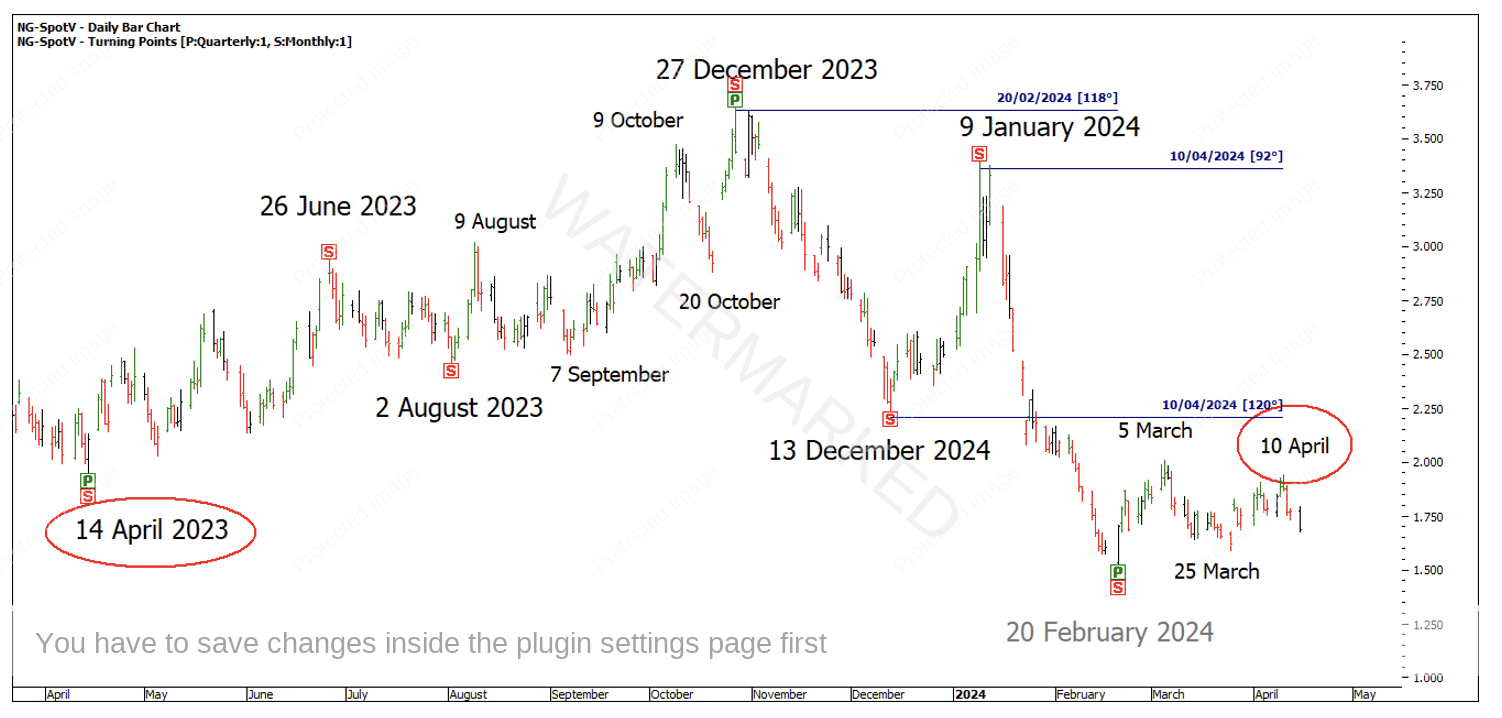
Chart 6 – Time by Degrees
The above gives us the recent times the market has been turning and the kind of Time by Degrees harmony I would like to see at the potential low if and when the price cluster is hit.
For now I’ll be watching the swing charts on the SpotV chart and just as importantly, the individual contract month! I’ll be looking for more major milestones to add into the cluster and counting sections of the market while also form reading the swings as it gets closer.
Something that is always great to see is an equal or even better, a contracting weekly price swing into a low that is a contracting weekly time swing!
Happy Trading,
Gus Hingeley