
The Volatile Road Continues
Picking up where we left off in last month’s discussion, Crude Oil has pushed on with a possible second leg higher, out of the July lows. I was happy with the initial volatile movement upward and was expecting that the next move may see similar strength, but it has left me in two minds as to whether the momentum is now over or whether there is some further upside to come. As I discussed last month, Crude has moved away from a market that trends strongly to one that requires a steady hand and patience followed by conviction as the setup arrives.
Market personalities can move around so we must adapt to their current state.
Chart 1 captures the recent move higher, running up 21 days, 25% of 84 that was discussed last month. A speed angle highlights where we might have been had we followed the pitch of the market, and the 50% level at $87.47 shows how we have stalled in this leg higher. That price will need to be cleared for any confidence of upside movement.
I am also watching for the end of month or around the 30th of August to signal the next big-time rock, so all these markers go into the trading framework of what to do if and when the market engages at these coordinates.
For all the reasons mentioned last month, the current July lows looks strong as a place for support to hold. So, will this mean we have to go higher or move back to a more sideways pattern? 84 as a number is leaving a few clues, test it yourself to see where it appears for you in its variations.
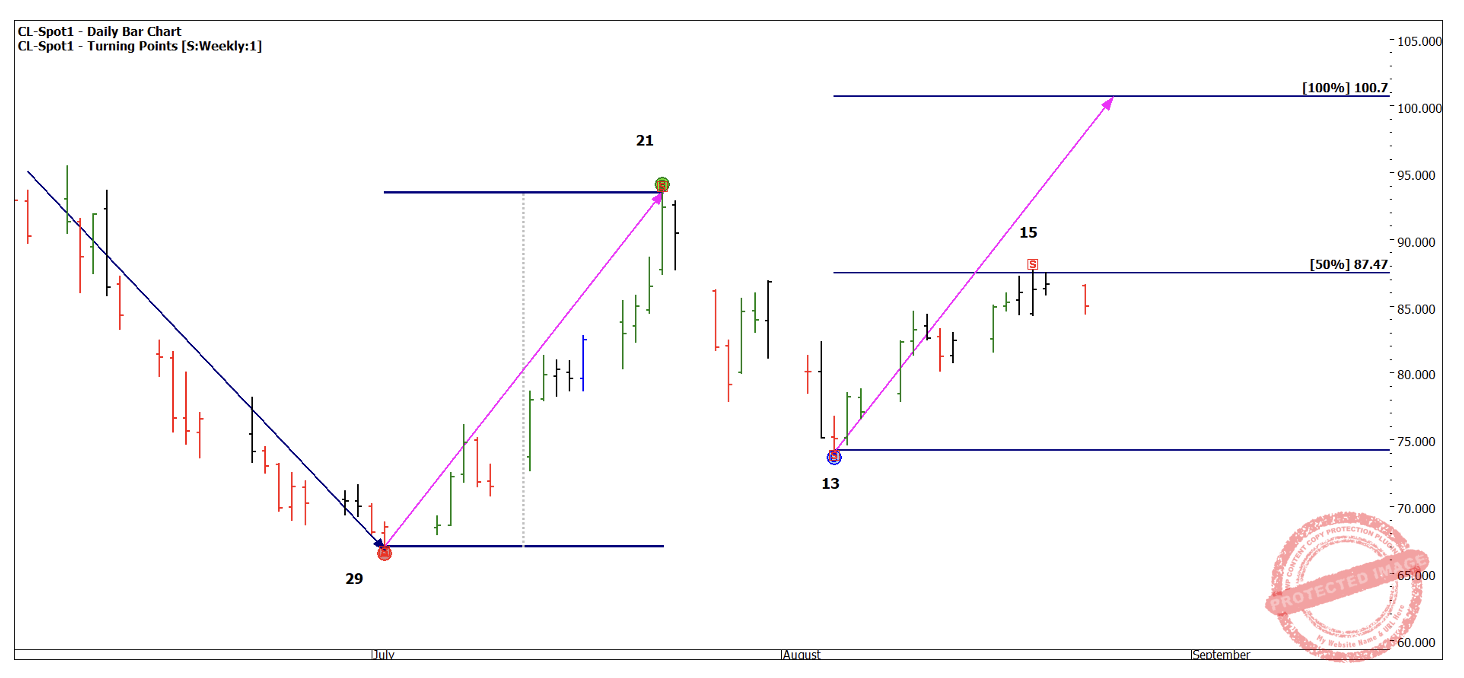
Chart 1 – Daily Bar Chart CL-Spot1
Chart 2 allows us to step into the bigger picture with price, the blue horizontal line is at $87.47, the current 50% of the small picture. The Ranges Resistance Card shows the all-time low and high and the relevant 50% level that I also keep an eye on at $76.89. Any failure at the current levels could send us back to that level, but for now price remains comfortably above that level.
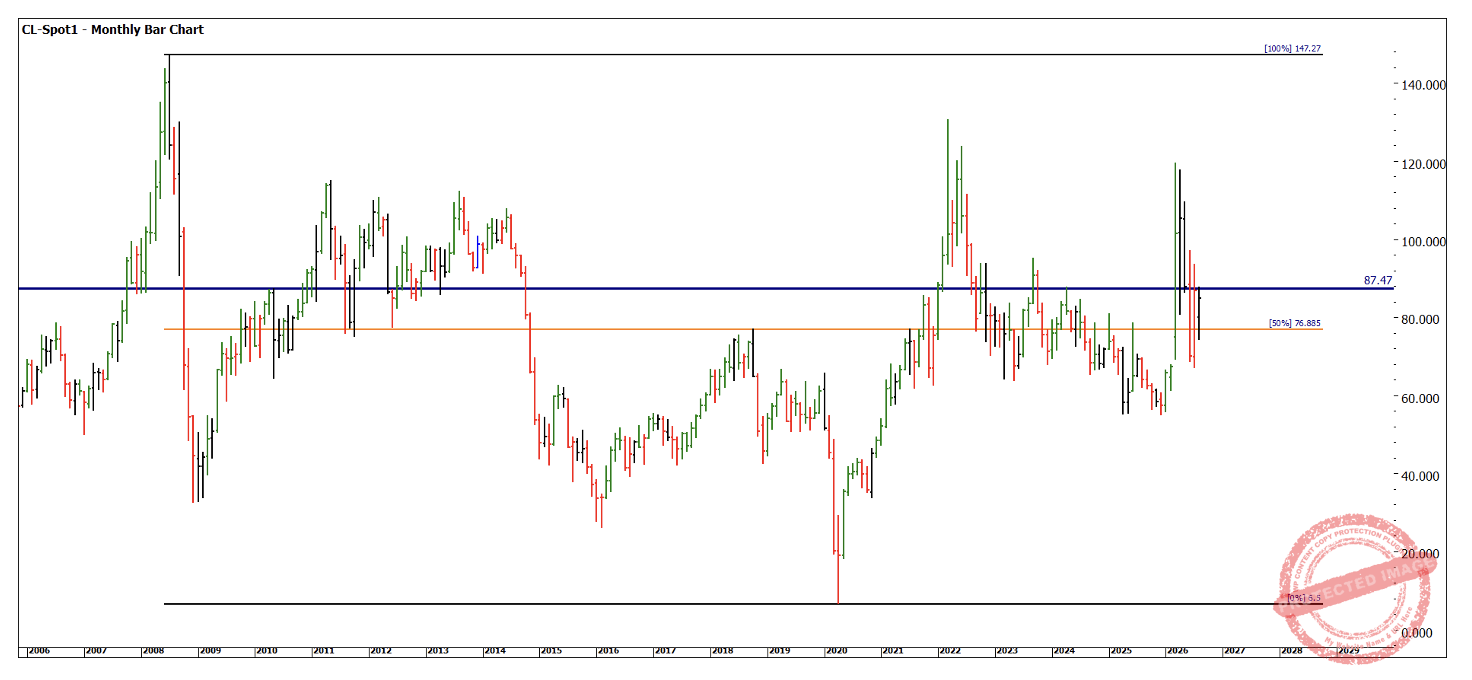
Chart 2 – Monthly Bar Chart CL-Spot1
Chart 3 keeps the big picture narrative, using the all-time low as the anchor. The high earlier this year held under the 1×1 with the 1×2 supporting the 2026 low, so we have our outer markets, so to speak to watch for any extreme moves to the boundaries.
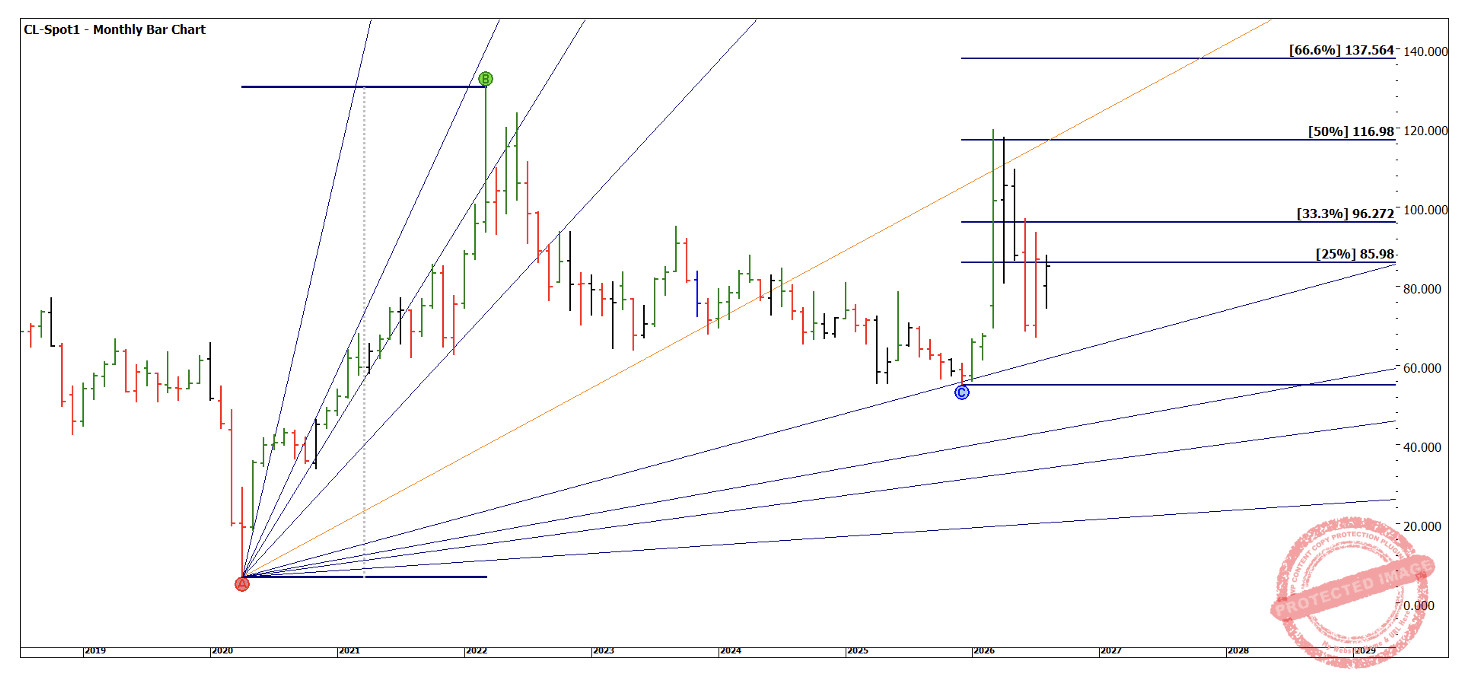
Chart 3 – Monthly Bar Chart CL-Spot1
Chart 4 continues the big picture theme around the value of the 50% that I have described in the small picture. The techniques remain the same, but we can adjust our time perspective.
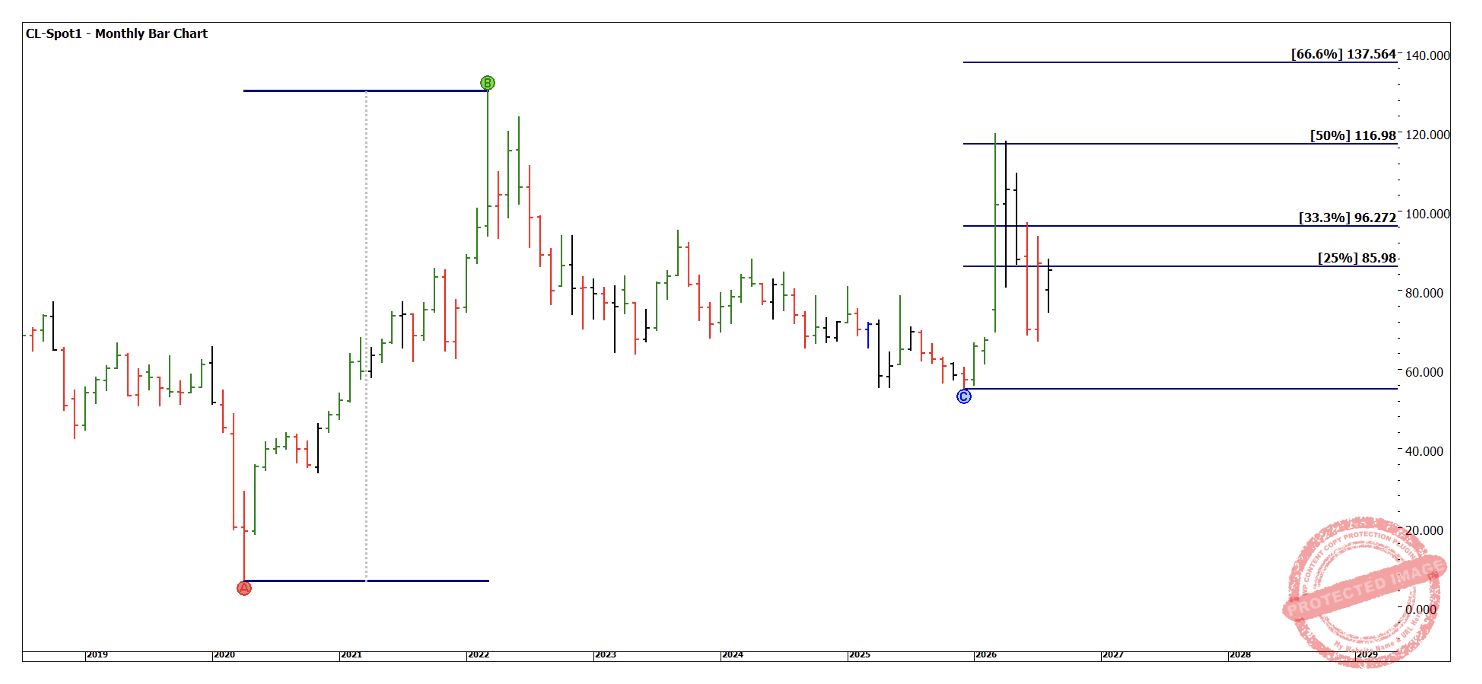
Chart 4 – Monthly Bar Chart CL-Spot1
Chart 5 helps me understand the position of the market relative to the square of the all-time low at $6.50. I have marked 3 circles that could be described as an ABC point loosely. Given they have all shown good position for a low or high based on the position in the square suggests wherever this current leg up concludes we should watch for harmony to align.
Note the low in August was on the midpoint of the square and the high later in the month is approximately 2 squares apart, so I can be safe to say the current range is 2 X $6.50 or $13.
For those keen to check, the current weekly up swing is $13.45.
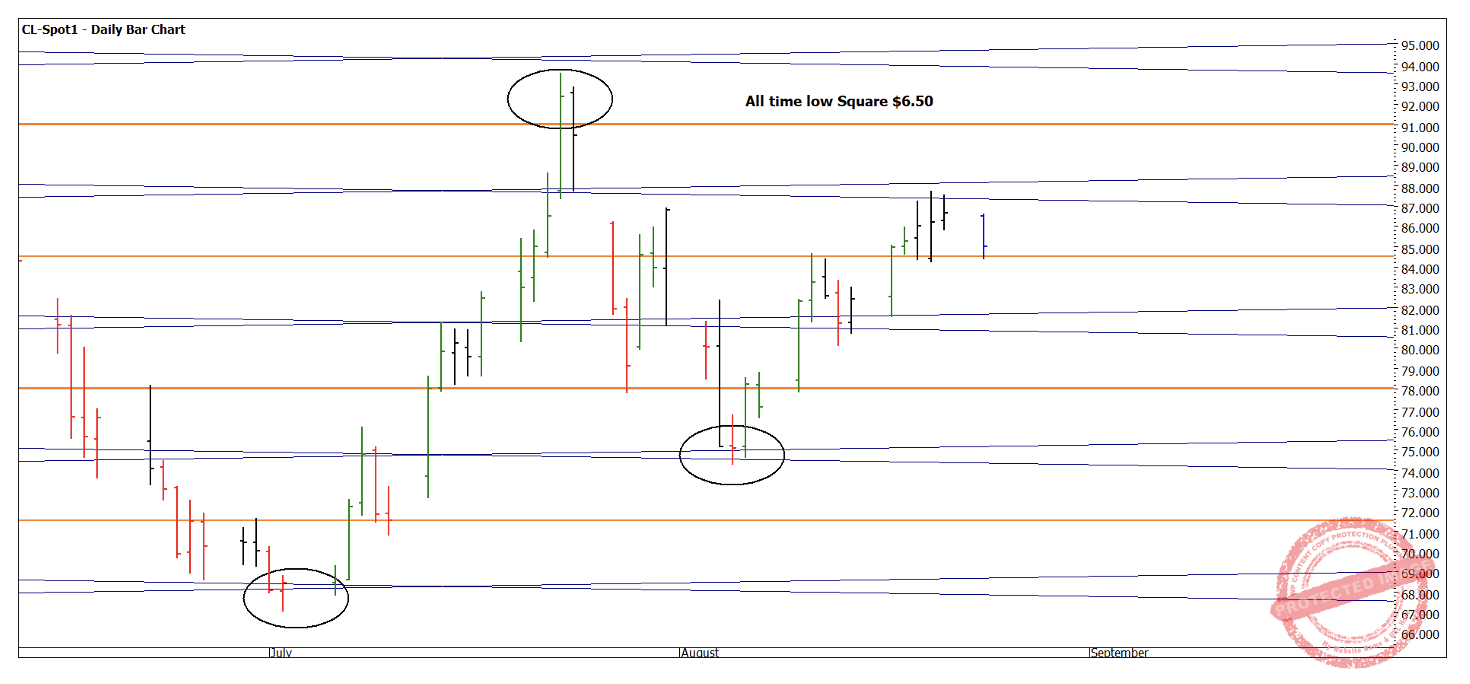
Chart 5 – Daily Bar Chart CL-Spot1
The July low to high was very strong and possibly abnormal in terms of the swing range, we could be a bit ambitious to see it repeat in the very next swing low in August to our current position.
That’s why I am patient to see what the market can do, this may mean higher prices. The 50% level of $87.47 needs to be broken and held for that to happen. Otherwise, we may see the end of August show us the move is over and we could see the gains given back.
The last 18 months has shown me there has been around 4 good trades a year in Crude and patience and timing has been key.
Look forward to discussing this with our coaching students and the community more broadly as it unfolds.
Good Trading
Aaron Lynch