
August Action
I require a lot of peace and quiet when it comes to my trading and can’t let any external noise infiltrate into my analysis as it effects my emotions and therefore may affect my decision making.
What I do need is a solid routine, structure and quiet to analyse the market based on techniques backed by probability.
In last month’s article I showed how the 90 and 30 Degree Vibration Wall Charts in combination with other W.D Gann techniques gave us two sets of dates to watch for turns on the SPI200. The first date being Friday 31 July to 3 August for a likely place for a daily higher swing bottom to occur and then to also watch for Friday 7 August to Monday 10 August.
I also had a small repeating 7-day time count, a 50% retracement on old tops and a 2×1 Gann Angle giving me 8687 as a price. See Chart 1 below from last month’s article.
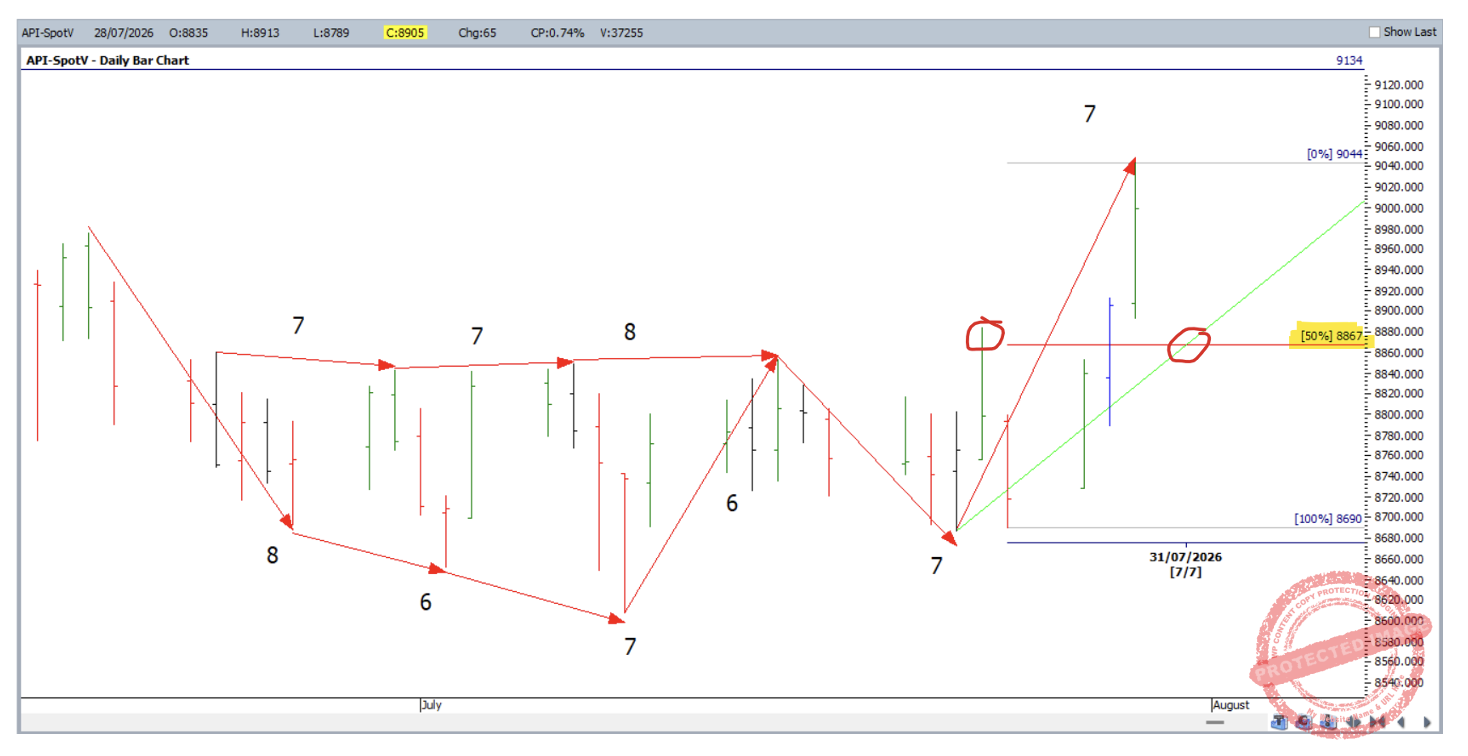
Chart 1
Both these dates gave turns in the market just highlighting how powerful a Time by Degrees Vibration Wall Charts can be. However, the daily higher swing bottom I was looking for came in on the Friday night session, although showed up on the Monday 3 August bar, and made a low at 8837, 30 points through the 50% daily swing retracement level of 8867 I was looking at.
In actual fact, it wasn’t the 2×1 calendar day angle and 50% retracement that called the 3 August low, it was the 2×1 trading day angle and 100% of the last daily swing range down that was the closer time and price cluster.
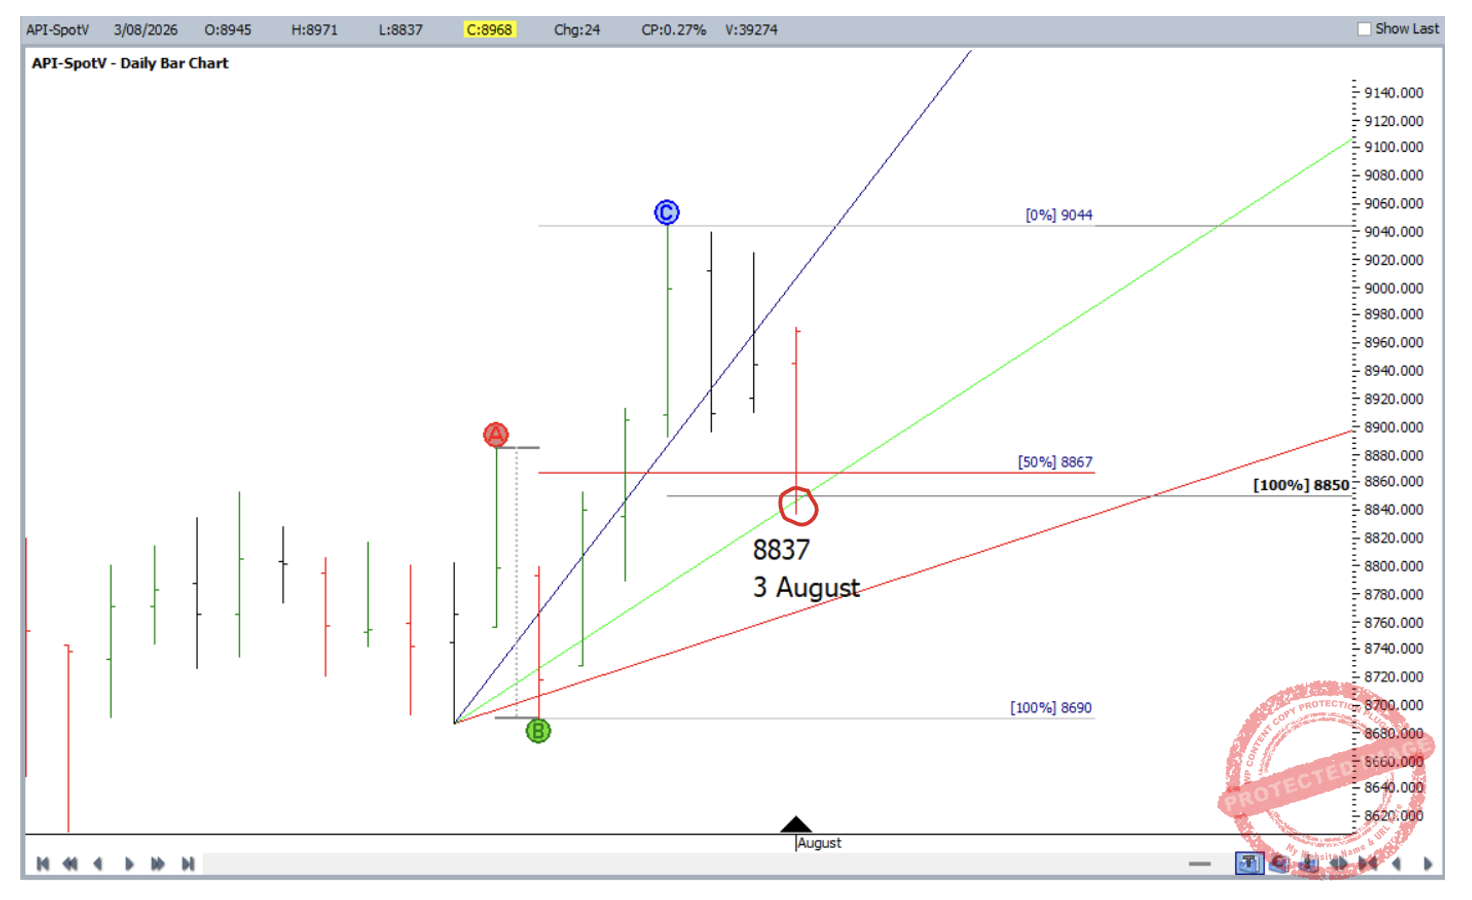
Chart 2
Instead of a repeating time count of 7 days, we actually saw a clear balancing of time of 5 days up and 5 days down.
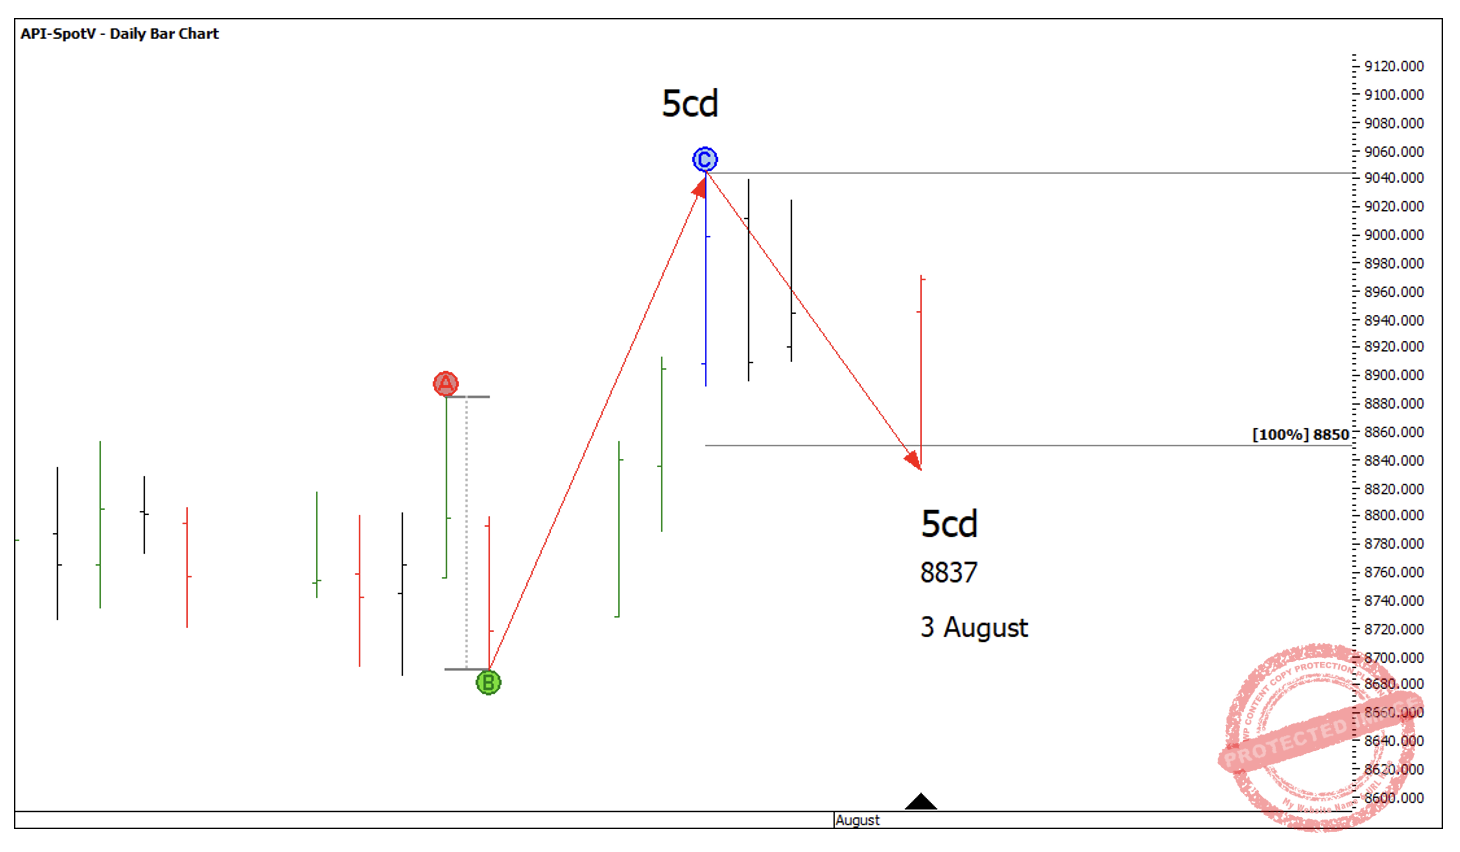
Chart 3
If you break that down on an hourly chart you can also see repeating time harmony with 56 hours low to low, and 57 hours high to low. Then, 64 hours up also repeated with 63 hours high to the first higher bottom.
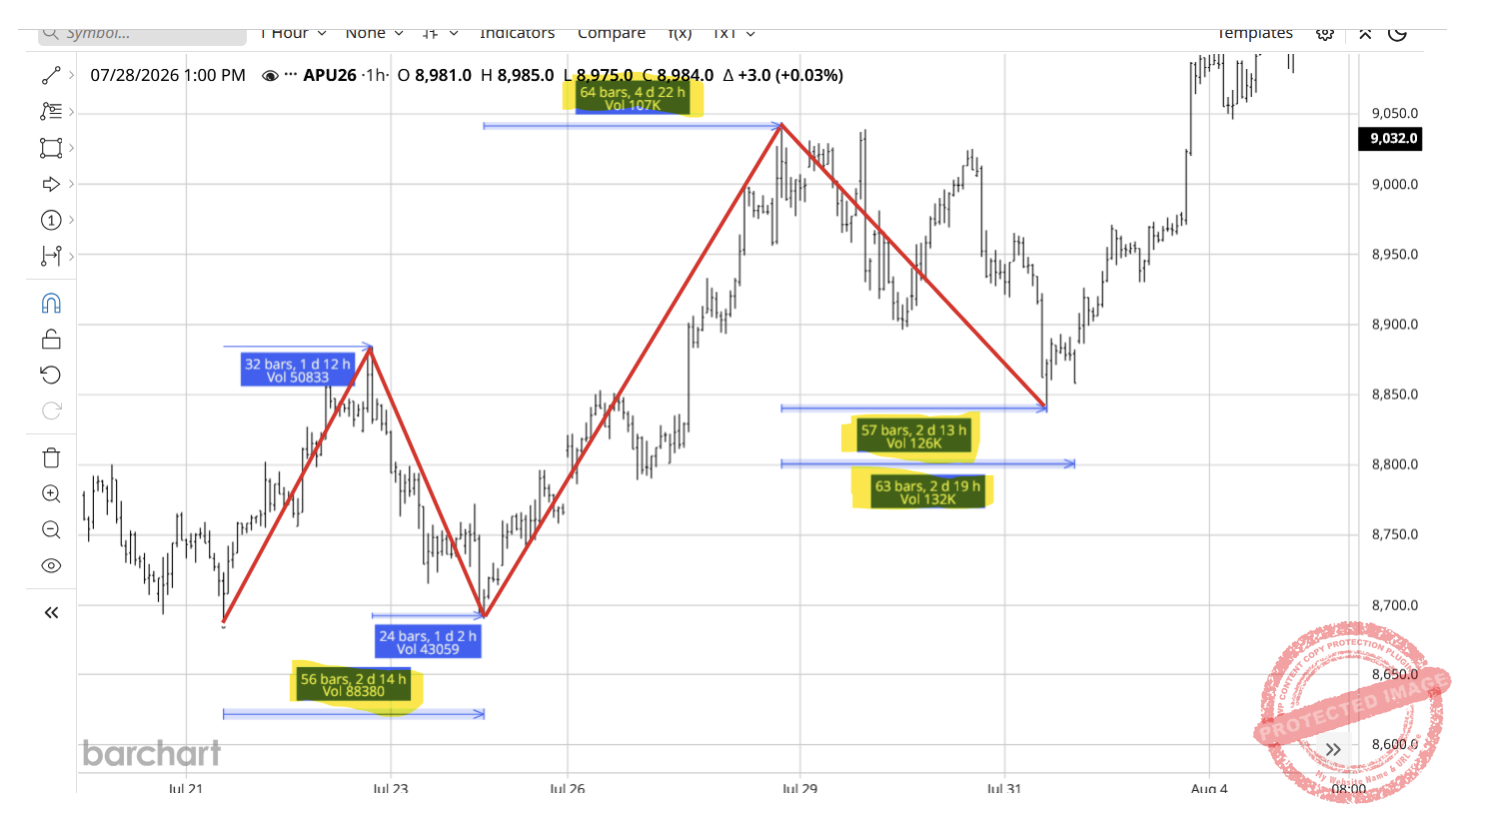
Chart 4
This makes a bottom to top and bottom to bottom time count within 1 hour of each other, with 120 hours verse 121 hours.
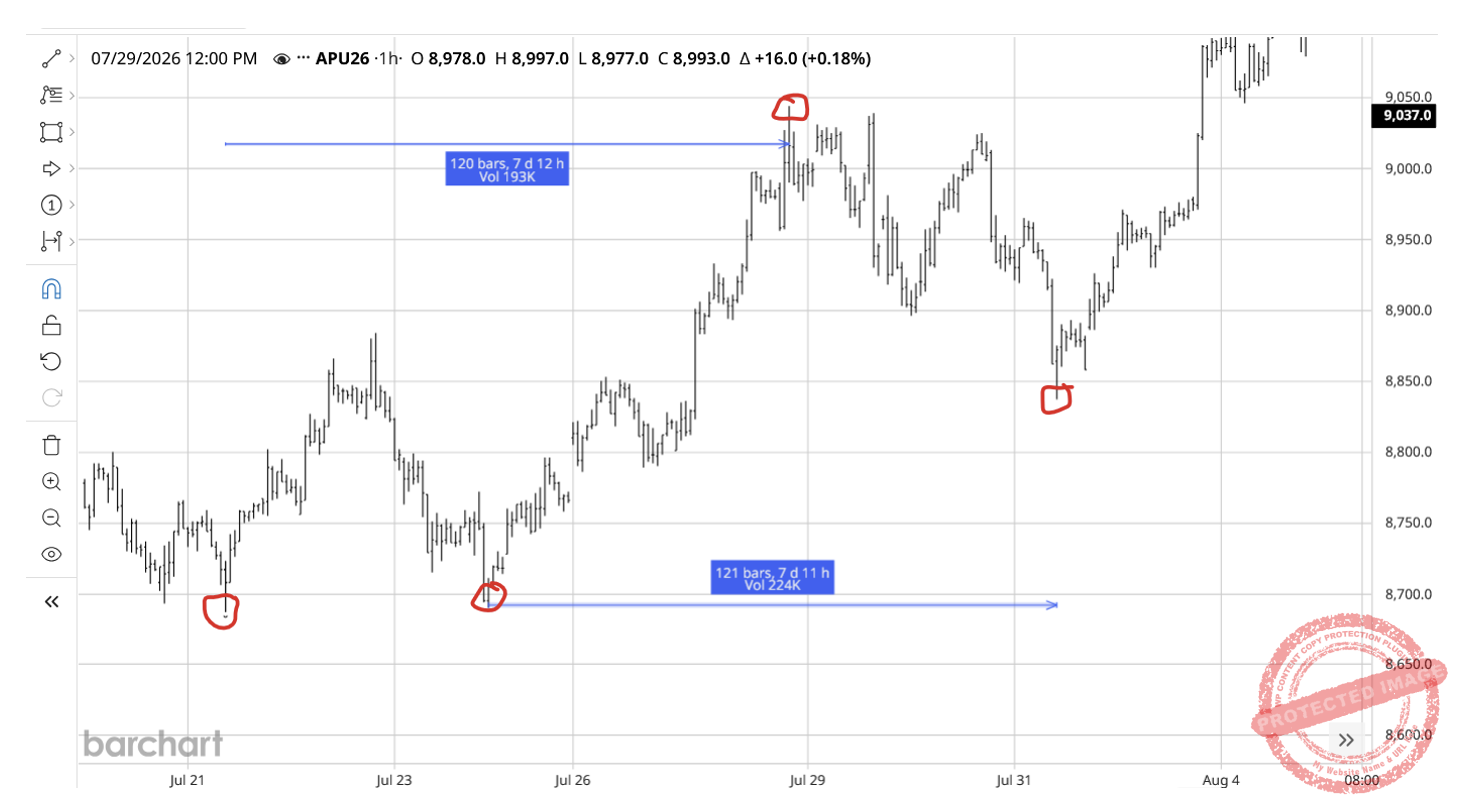
Chart 5
The Friday’s night session closed on its low, but the market gapped up on Monday morning giving a strong Long the Openers signal.
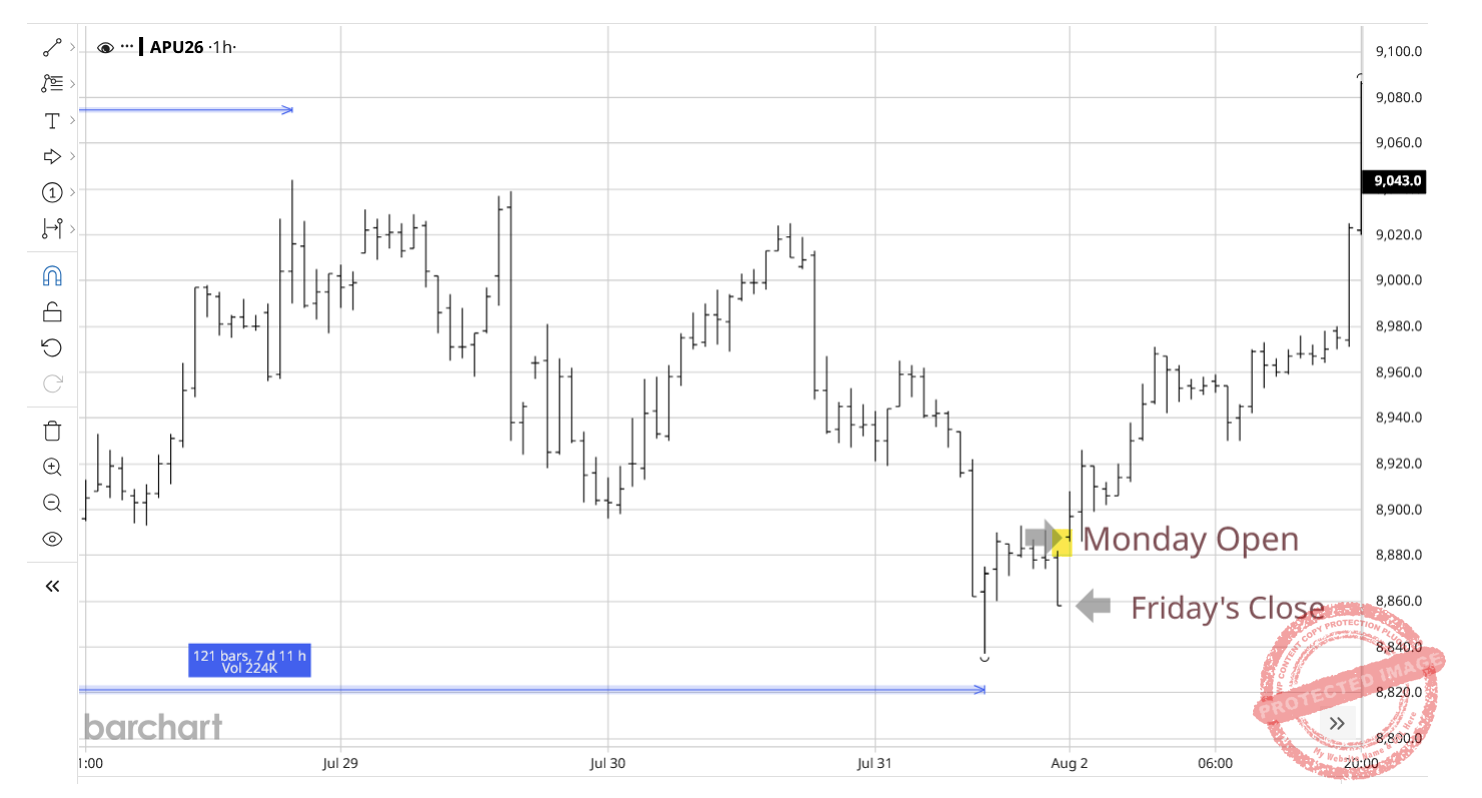
Chart 6
Since then, the market rallied straight into the monthly 1×1 at 10 points per month angle from the GFC high creating triple tops on the August seasonal date.
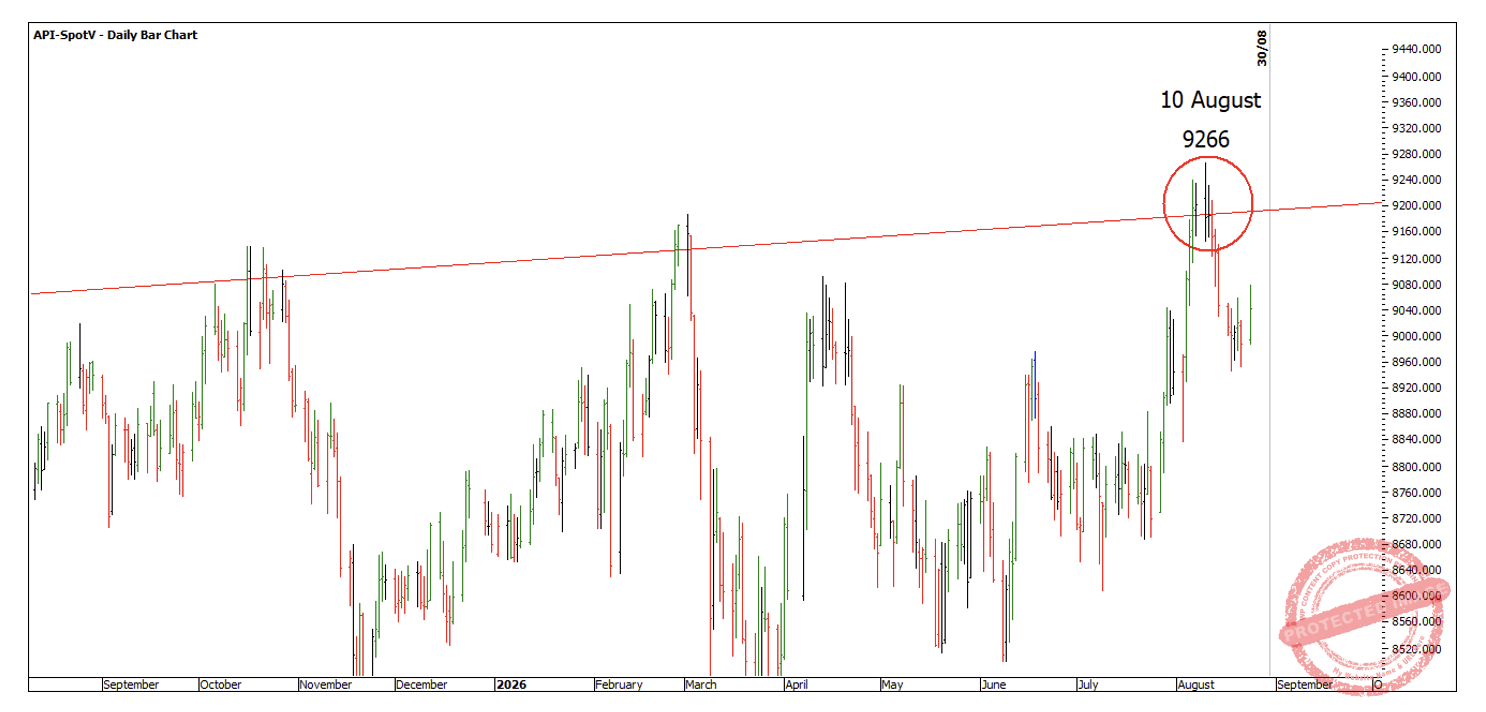
Chart 7
You can also use a trendline connecting the tops here that provides resistance for the current market and new all-time high.
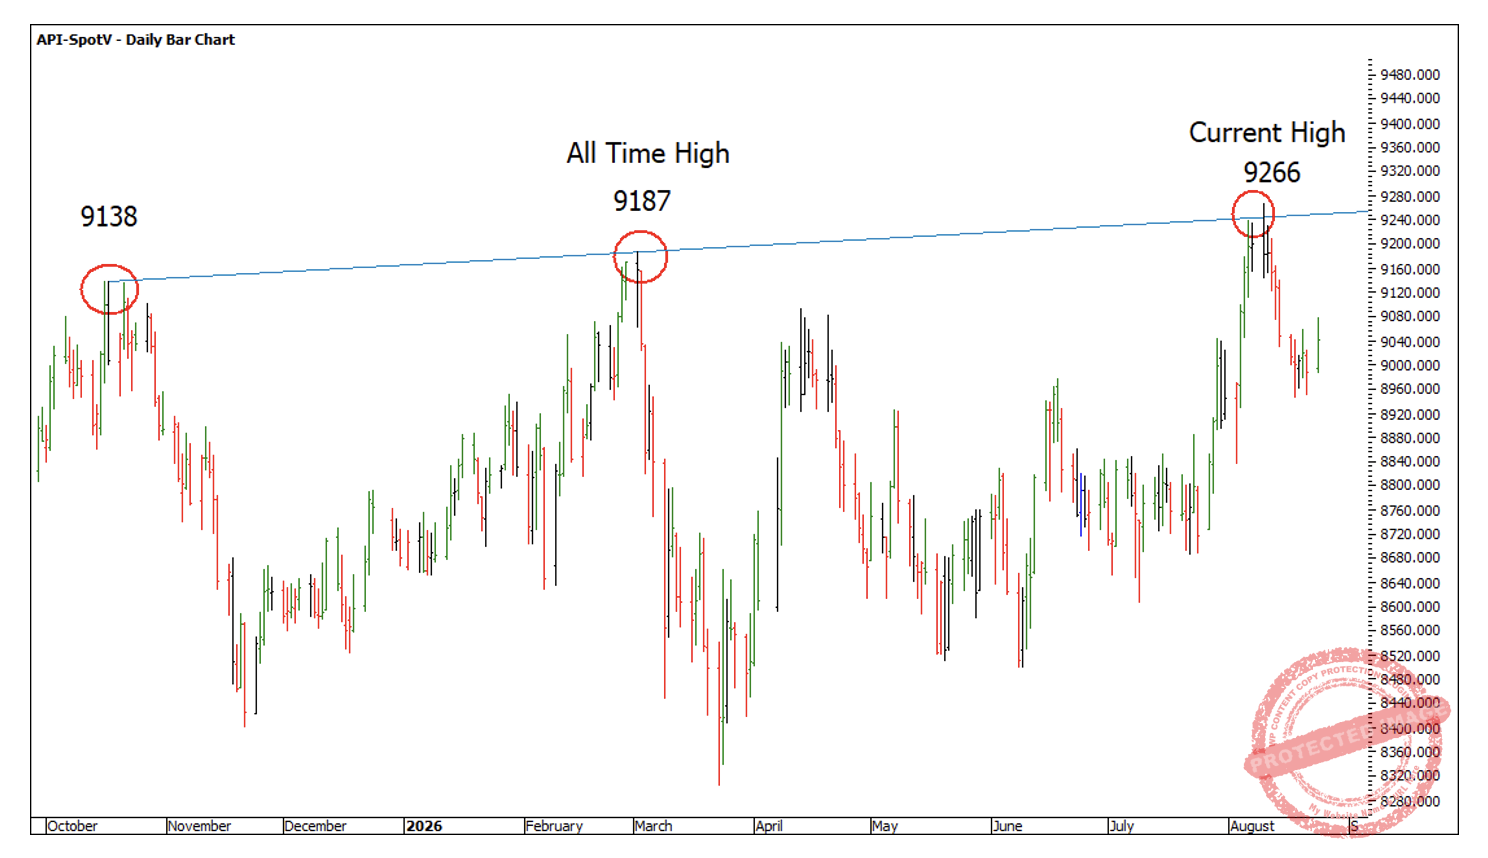
Chart 8
It’s not surprising to see the market pull back after trading into such a strong angle from the GFC high and based on the Dow Jones 100 year cycle and the SPI squaring out the GFC high in days, it wouldn’t be a big surprise to see more to the downside.
It would pay to keep your form reading current, as the position of the SPI is currently trading between two 1×1 Gann Angles and just above the weekly 50% retracement. This shows me the market is trading strong against the 1×1 running up from the last weekly swing low and strong against the 50% retracement but then weak against the 1×1 running down from the current all-time high.
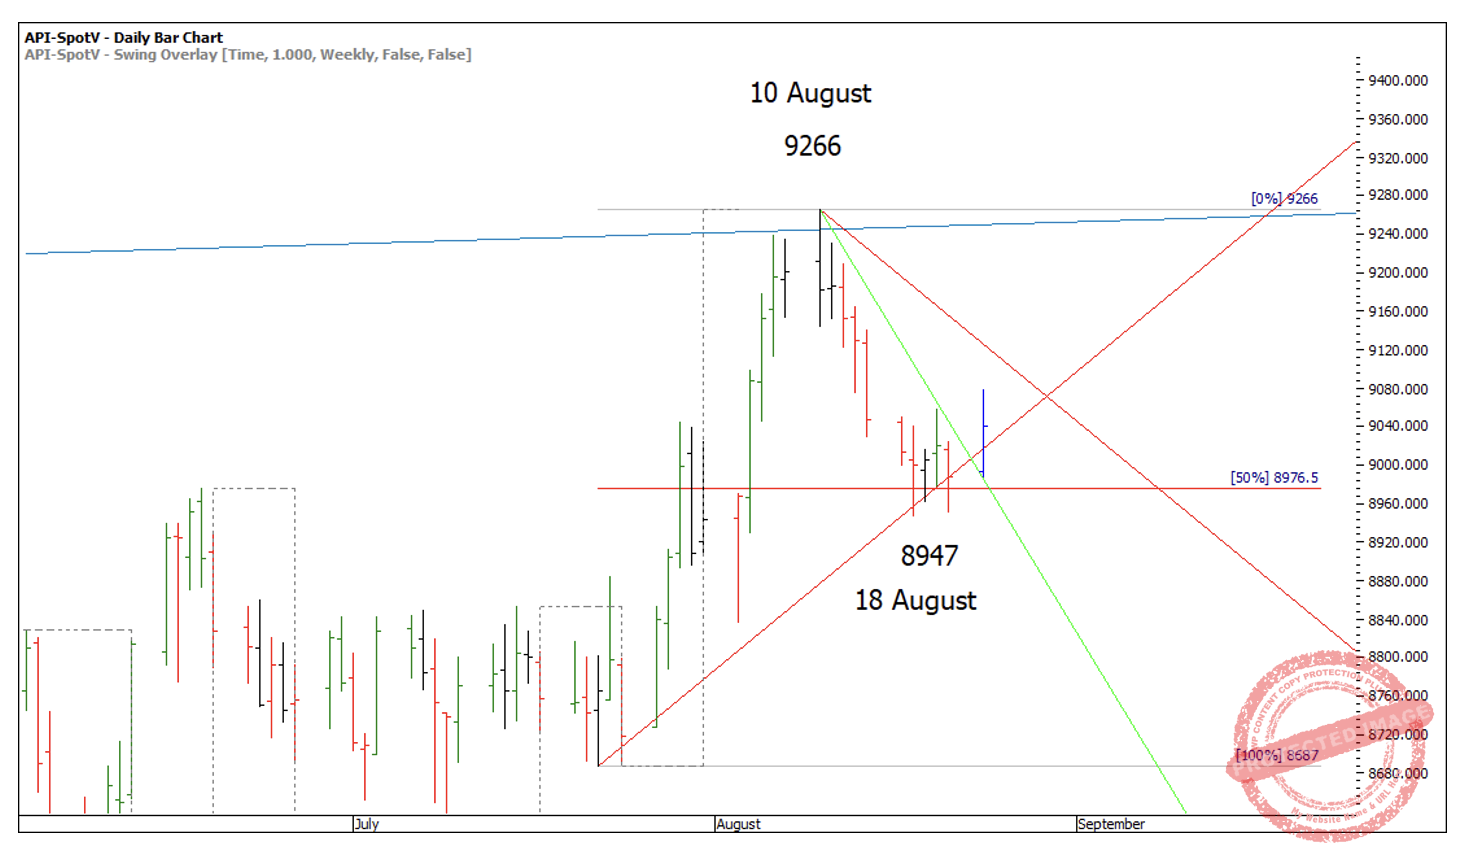
Chart 9
You can never discount the option for more sideways action, so I would like to either see lower tops under the 1×1 running up and the 50% retracement to take short positions as that would be in a weaker position or be above the trend line tops to take a long position. Another test of the trend line would also be the fourth attempt which W.D Gann has a rule for.
Happy trading,
Gus