A Gann Plan
Welcome to my last Platinum Article for 2023. Being the last for the year I wanted to pack it with as much as possible and give you plenty to consider going into 2024.
“Remember the rule: Tops or ceilings which are selling points become floors, supports or buying points after these tops have been crossed and the market reacts to them, or sells slightly below them”
P7, 45 Years in Wall Street
Gann tells us to sell or buy at old tops or bottoms, whole numbers and natural resistance levels. He also says to watch when important ‘time periods’ run out around these levels.
First case study is an Australian stock, Woodside, ticker code ‘WDS’ in ProfitSource.
WD Gann says to watch 50% levels of ALL major ranges. One of Woodside’s major ranges is the 7 March 2003 low of $9.65 to 22 May 2008 high of $69.15. As you can see in Chart 1 below, the 50% level at $39.40 has proven very significant.
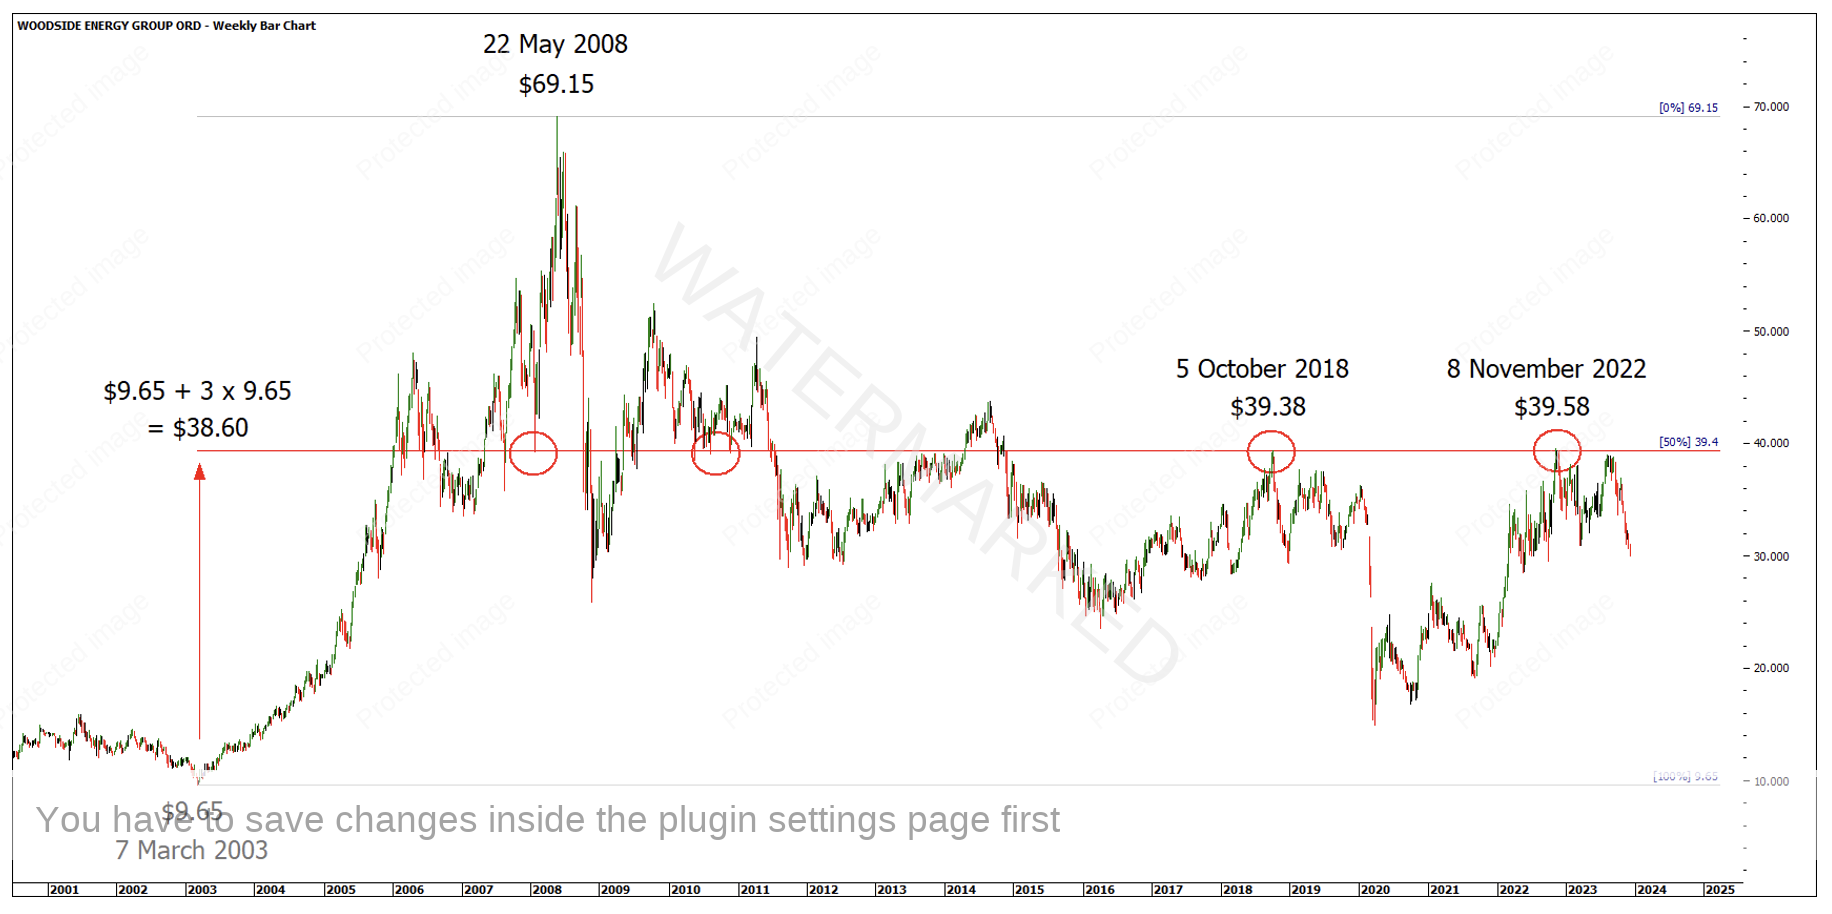
Chart 1 – Major Range 50%
I find Gann is always referencing important time periods with support or resistance levels. If you read Rule 10 (45 Years in Wall Street), ‘Change in Trend in Bull Market’, he says to
“Always check to see if the market is exactly, 1,2,3, 4 or 5 years from any extreme High or Low price. Check back to see if the Time Period is 15, 22, 34, 42, 48 or 49 months. These are important time periods to watch for Change in Trend”
Interestingly, 49 months back from the 8 November 2022 high gives you the previous 5 October top. Another 49 months back from 5 October 2018 gives the 26 August 2014 top, which then makes it balancing time.
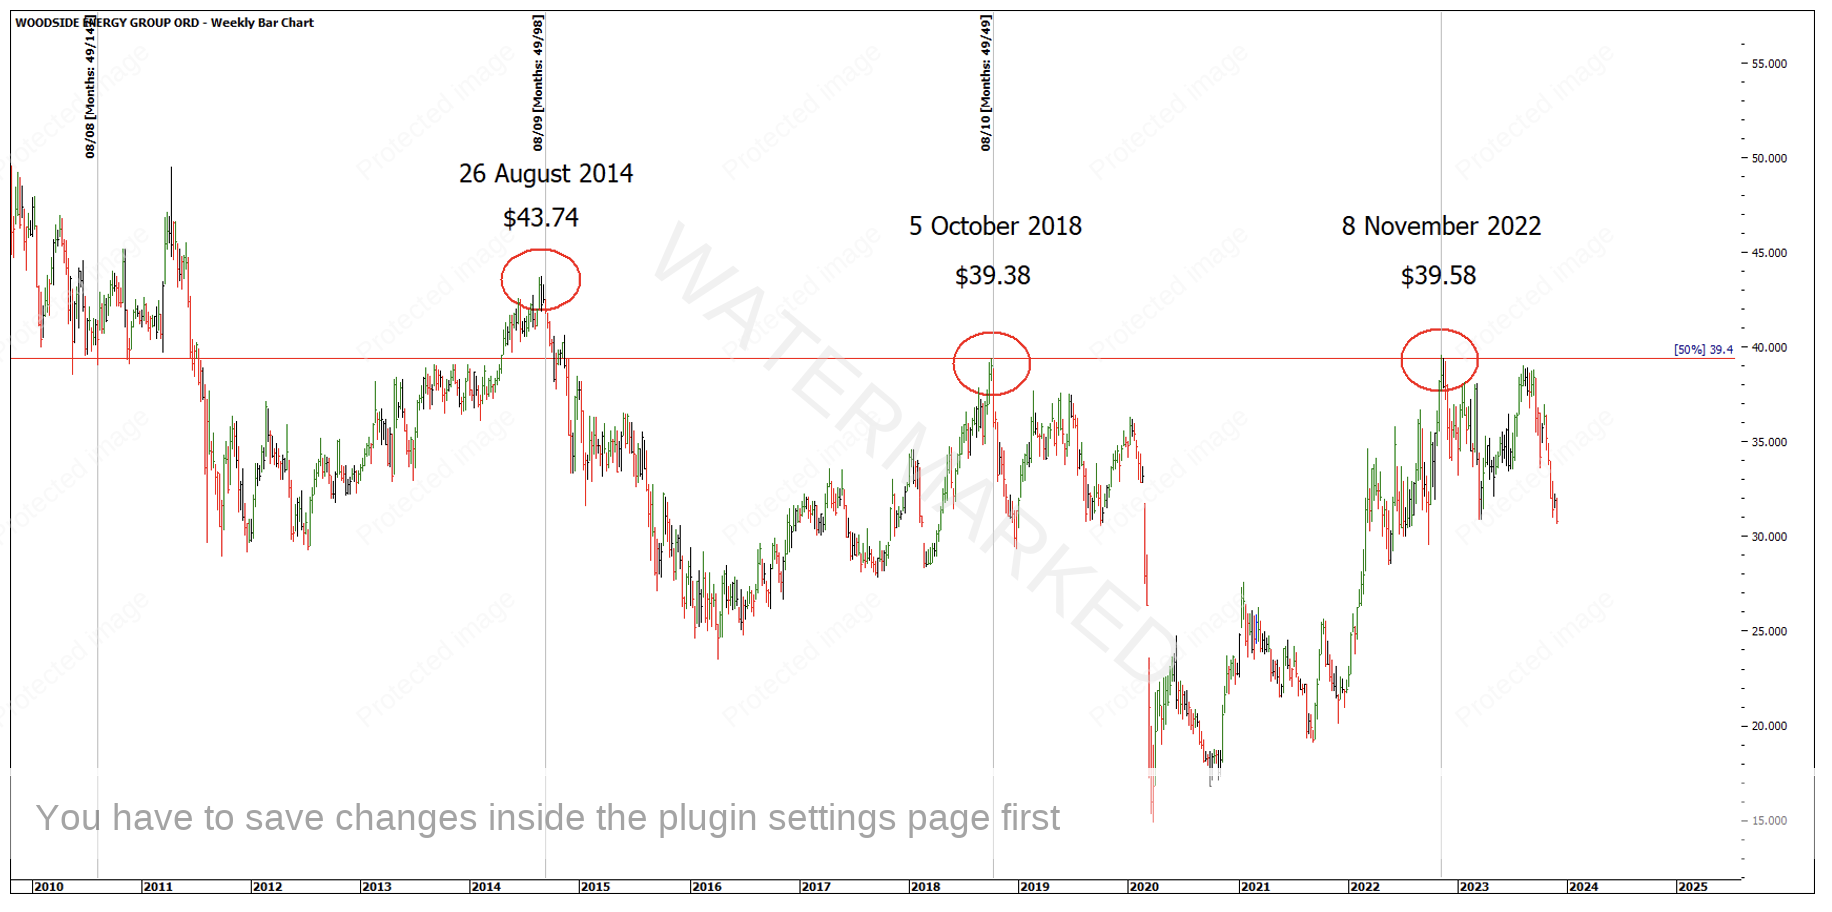
Chart 2 – Balancing Time
For a potential entry in hindsight, there was a contracting daily swing range on 16 November that re- tested the 50% level of the major range to the point!
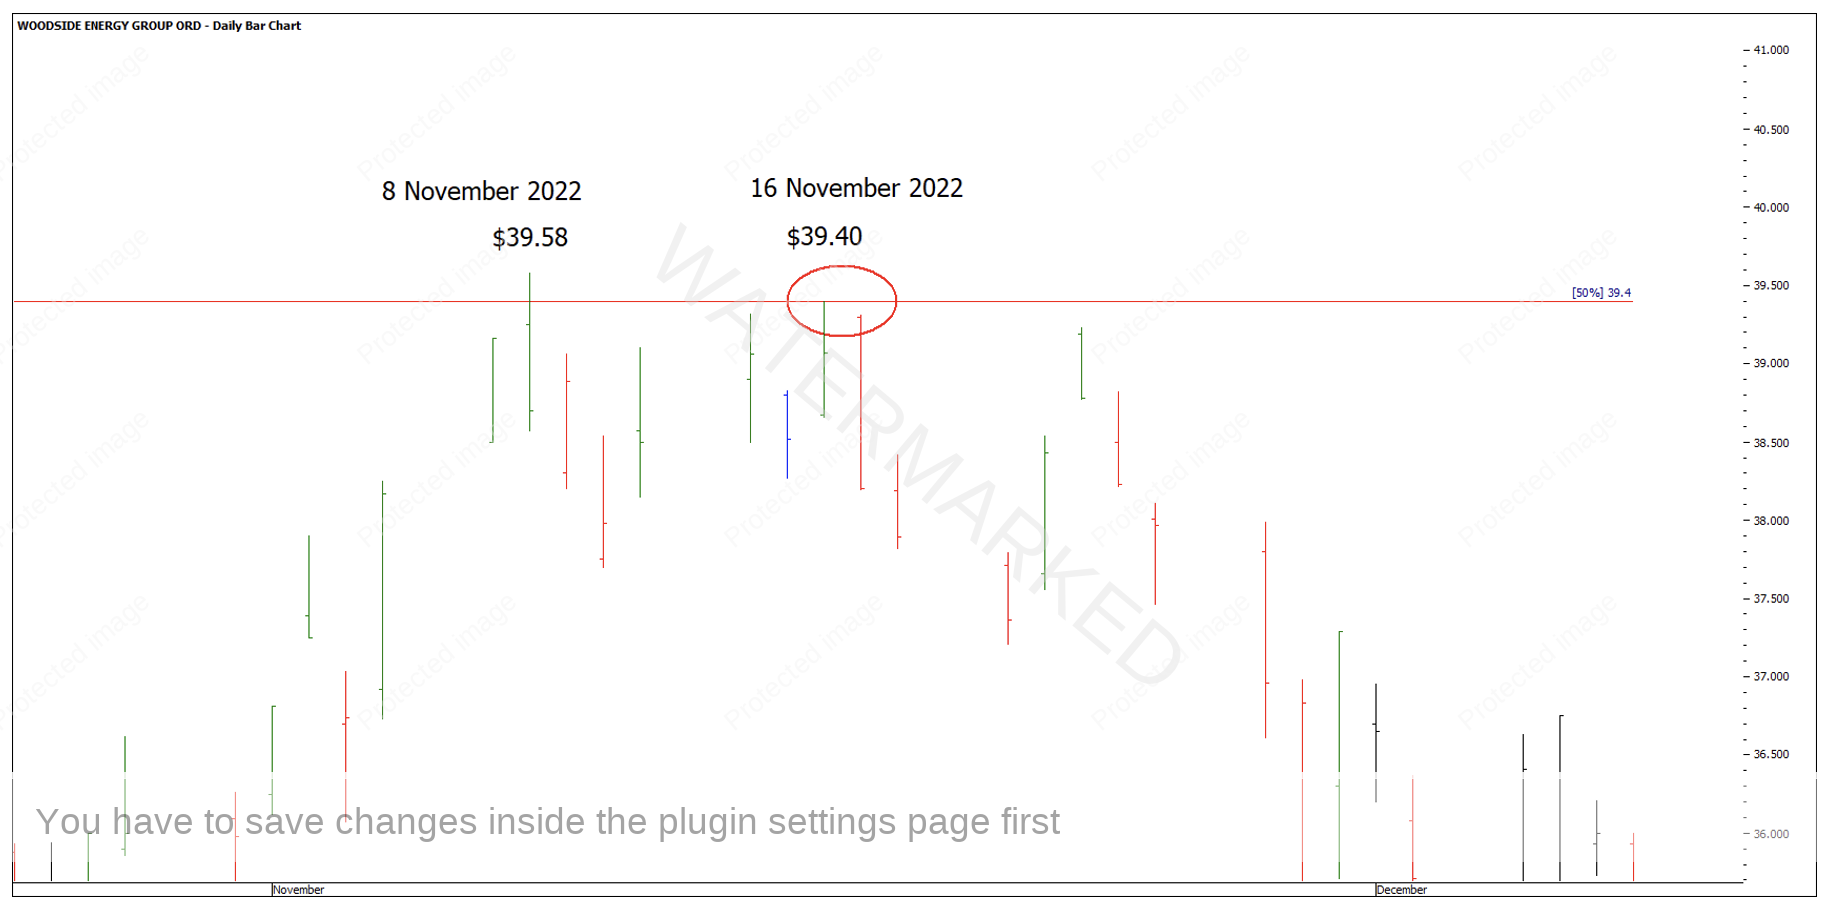
Chart 3 – Potential Entry
The above chart is a great case of old bottoms becoming new tops, multiples of a major low, 50% of a major range, Anniversaries, Balancing Time, Time by Degrees, Double Tops, Sections of the Market, and whole numbers (or very close to) acting as major resistance.
A more recent example of an old top becoming a new support level is on the Nikkei Dow or NK-SpotV in ProfitSource. The 4 October 2023 low sits on top of previous All Time Highs made back in 2021.
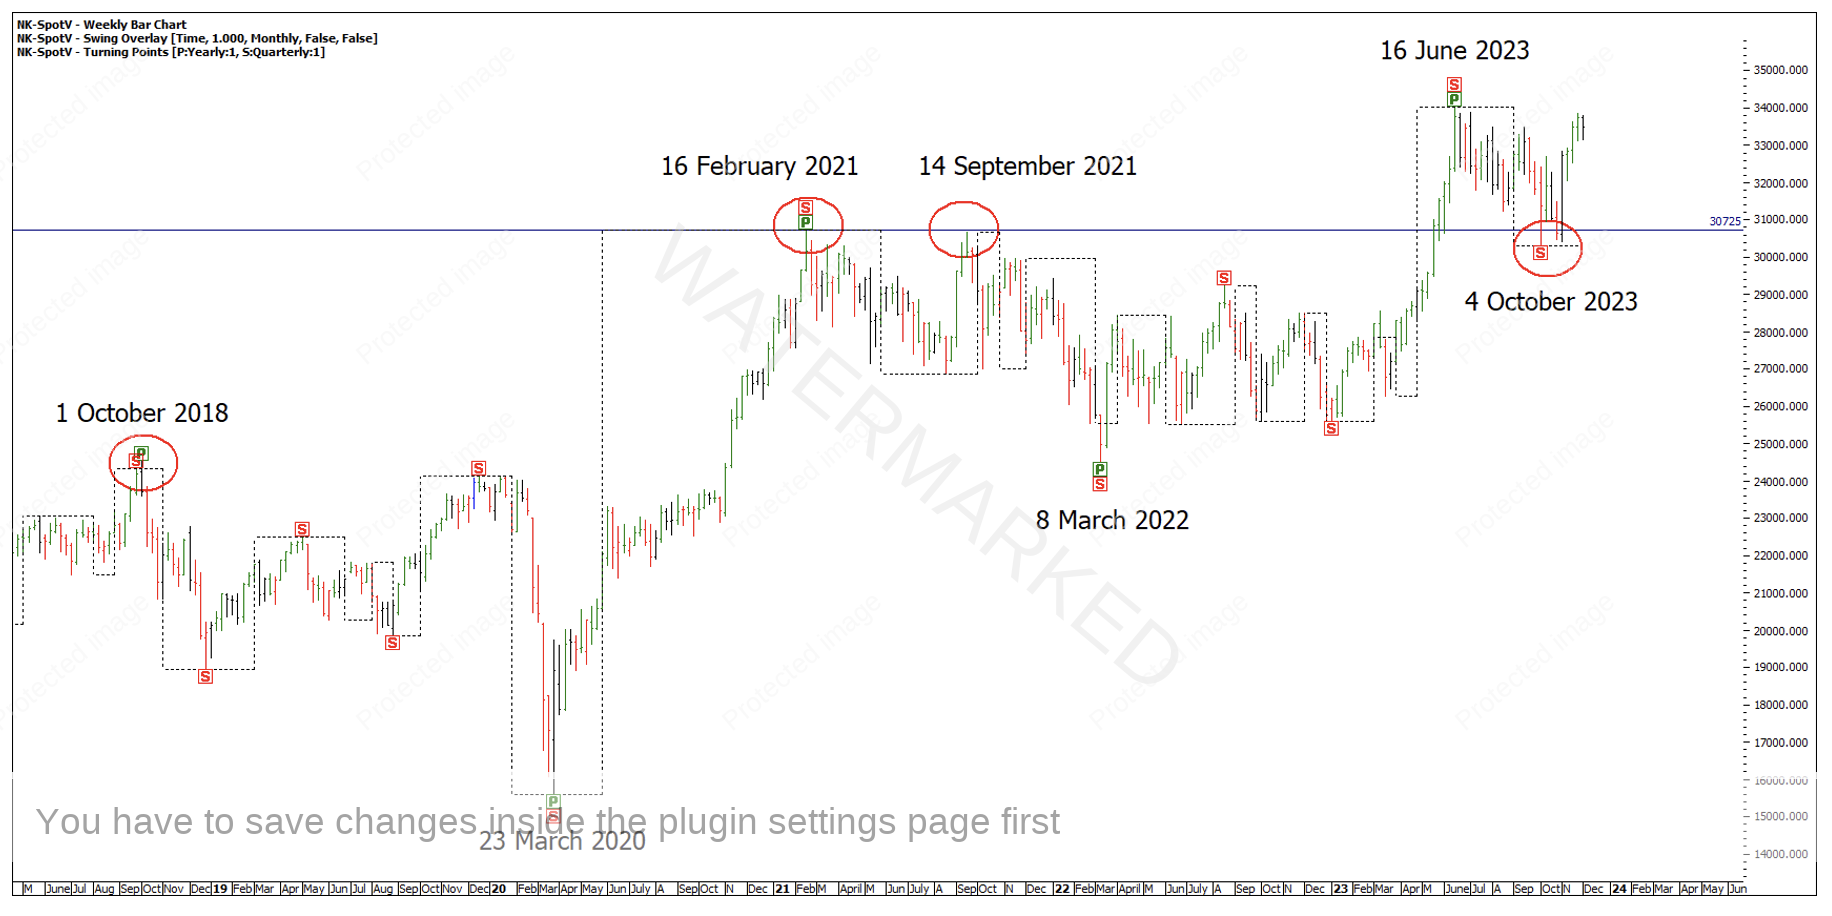
Chart 4 – Old Tops becoming New Bottoms
The 4 October low is close to a 2 year anniversary from the 14 September 2021 high and near exact 5 year anniversary from the 1 October 2018 high.
That means the Quarterly and Monthly swing chart low or Point C looks to be in a strong position, sitting on old All Time Highs and above a 50% retracement. I can also identity 4 clear weekly sections down with a weekly higher bottom on an EXACT 100% repeat of the last quarterly swing down at 30,405!
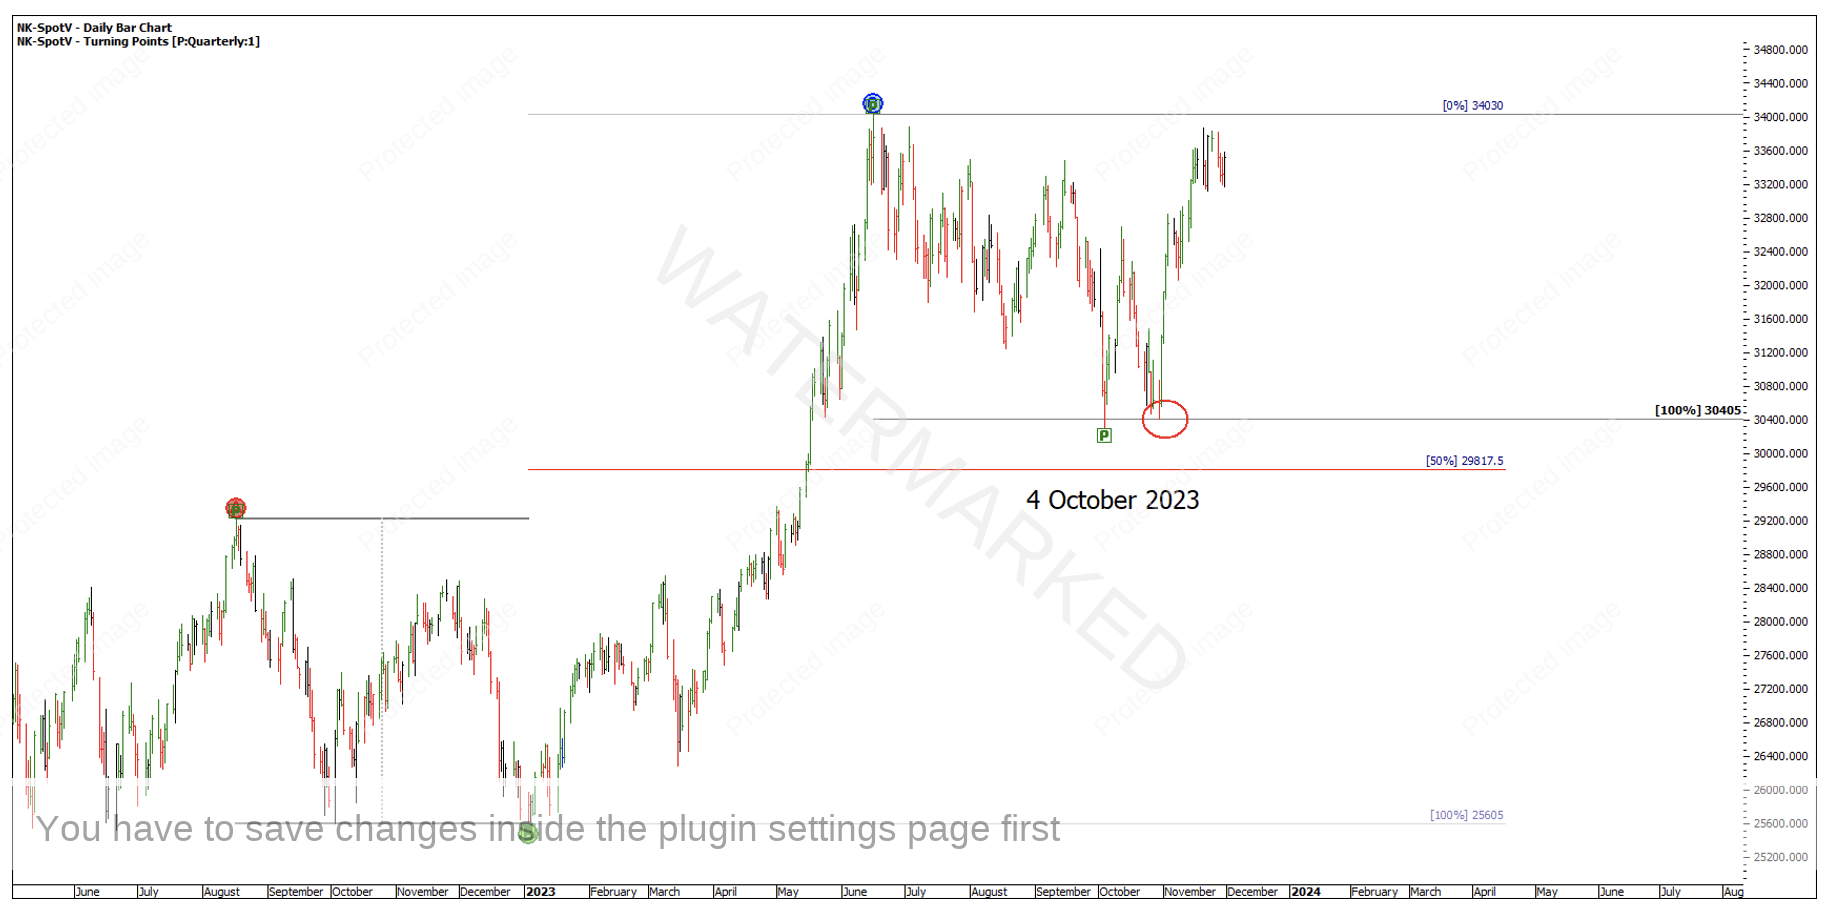
Chart 5 – Nikkei Dow
A commodity of interest also nearing a 4th major top is Gold. Breaking through these highs would put Gold into new All Time Highs.
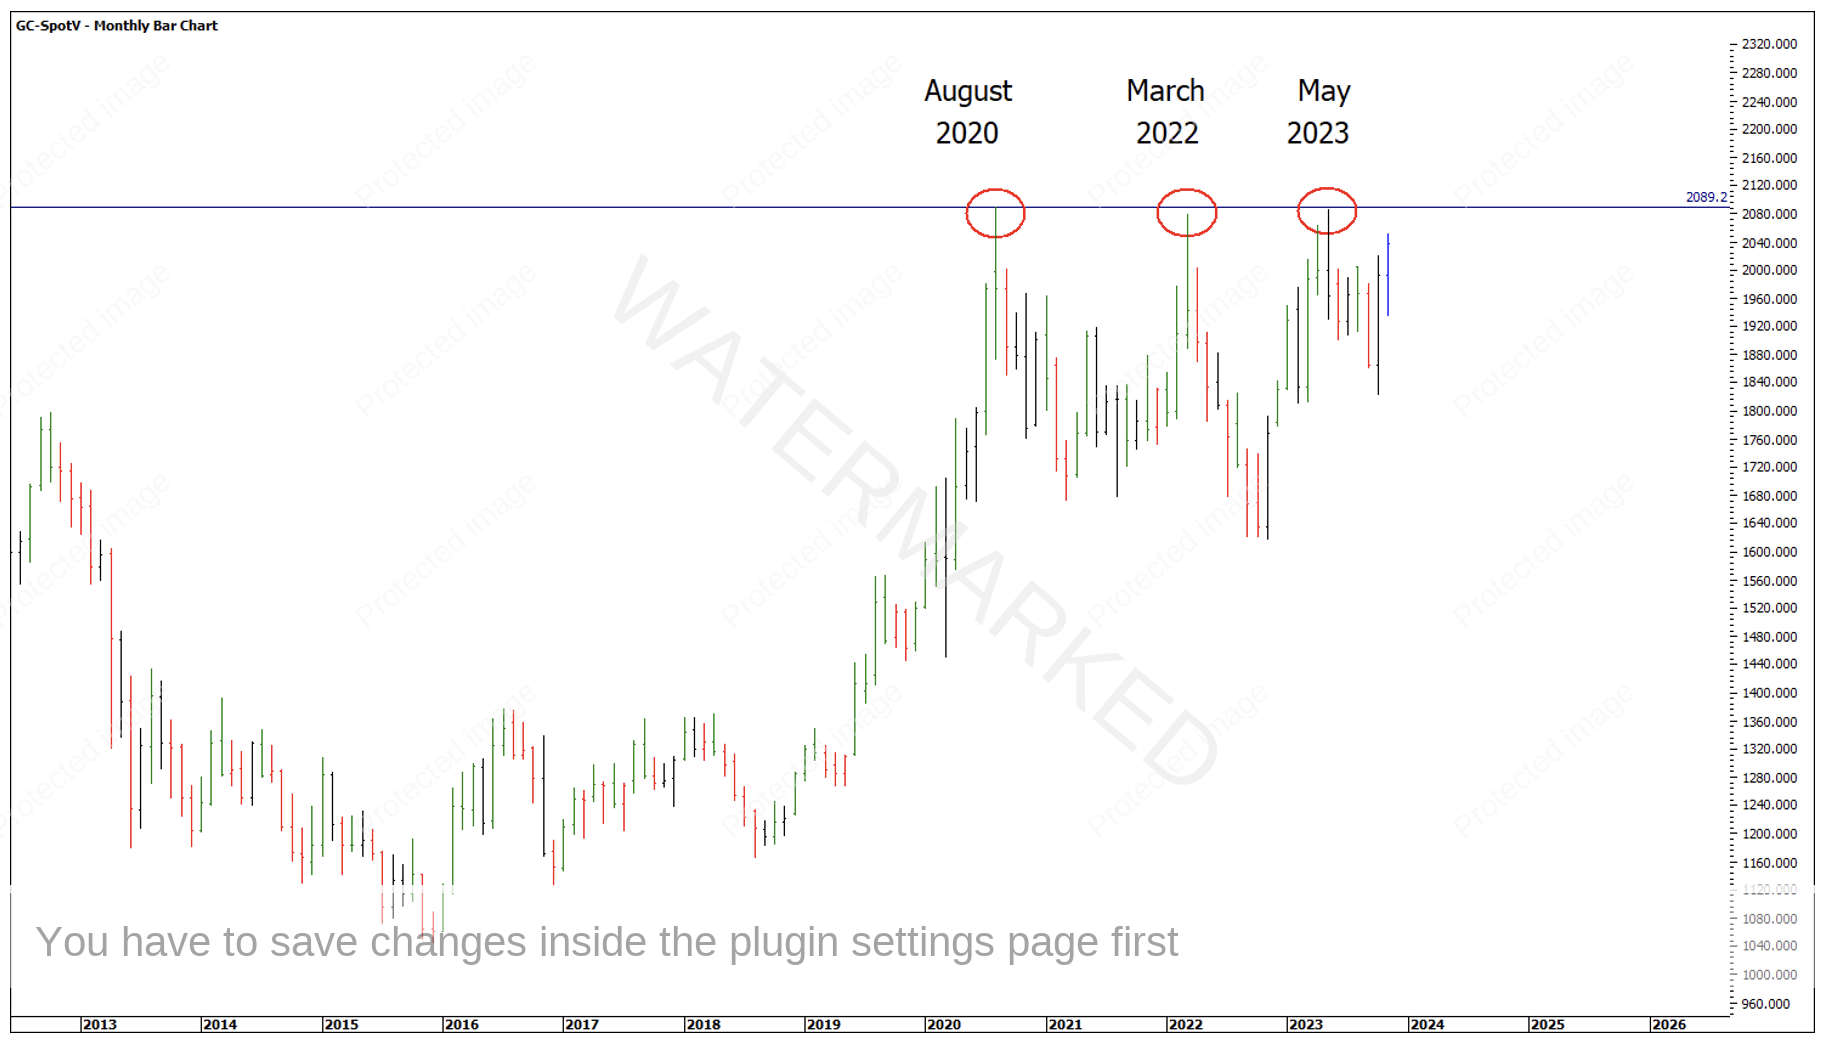
Chart 6 – Gold Approaching a 4th Top
Remember Gann’s rule about multiple tops at the same level.
“Do not overlook the fact that the 4th time the averages or an individual stock reaches the same level it is not as safe to sell, because it nearly always goes through”
Lastly, the Dow Jones has just confirmed a quarterly outside bar meaning this market is one more top away from breaking into new All Time Highs. The current quarterly swing low is 27 October 2023.
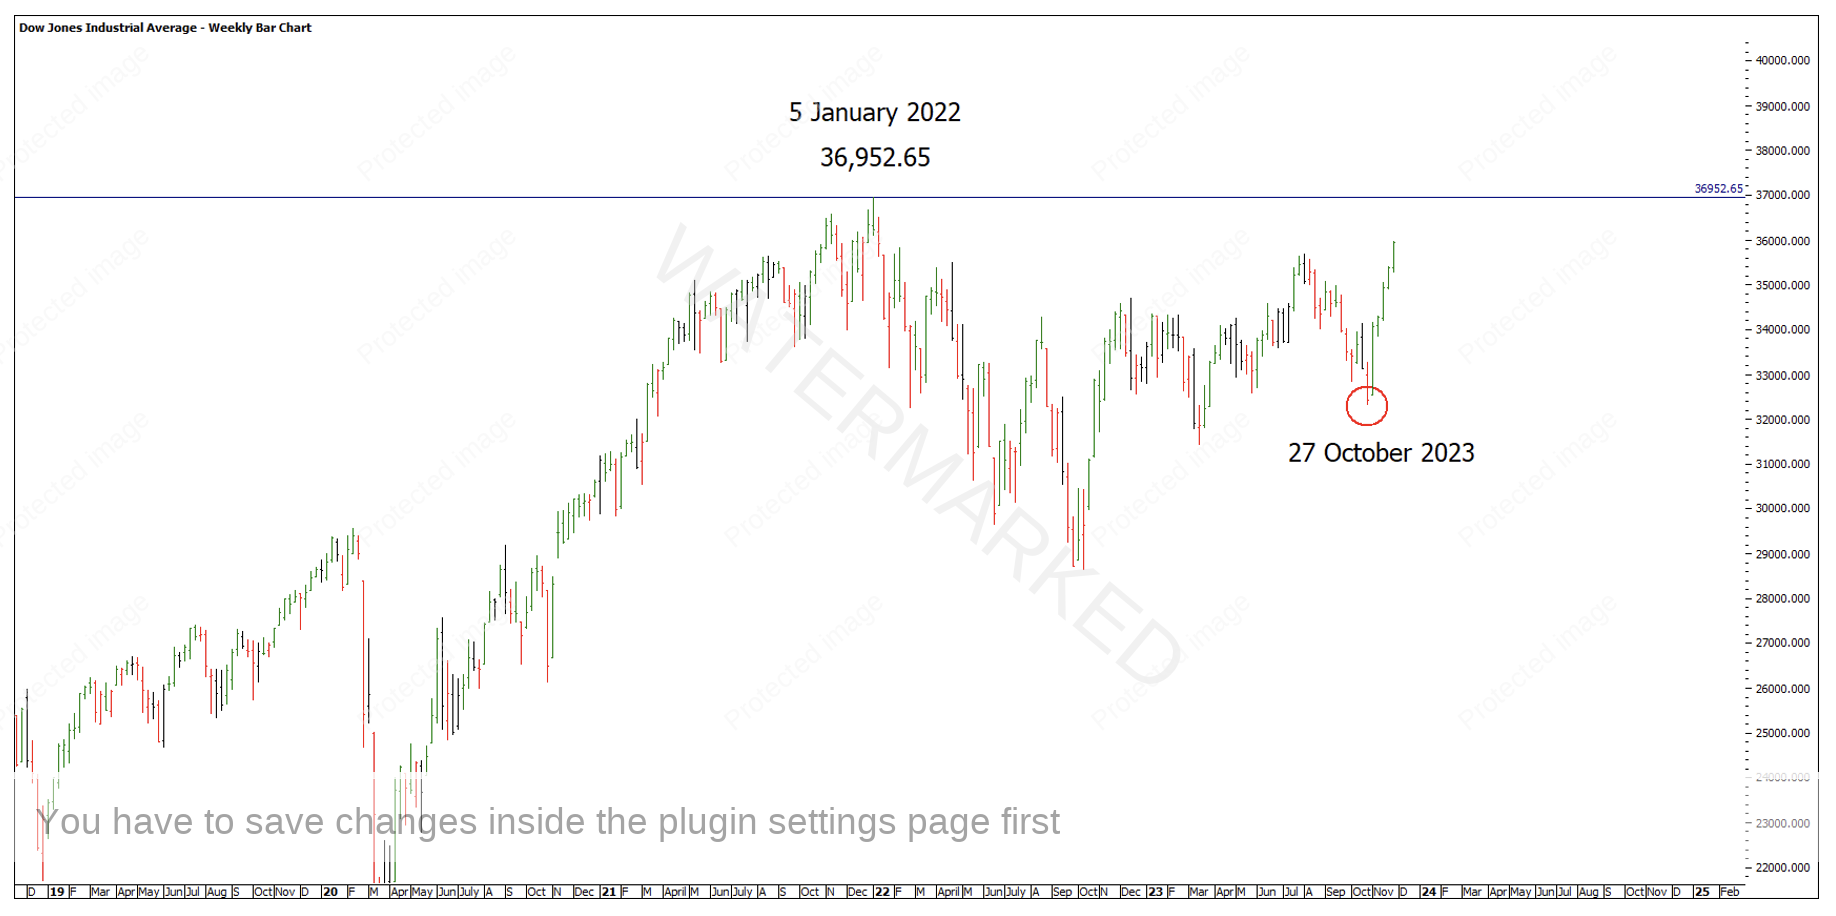
Chart 7 – Dow Jones
In DVD 9 of the Ultimate Gann Course, David Bowden talks about the 100 year Cycle. In Tunnel Through the Air, Robert Gordon talks about the 100 Year Cycle.
Looking at a chart of the Dow Jones INDU in ProfitSource, we can go back 100 years which takes us back to 1923. The data is patchy so looking at a monthly bar chart is best. W.D Gann talks about the yearly low for 1923 being 27 October at 85.50.
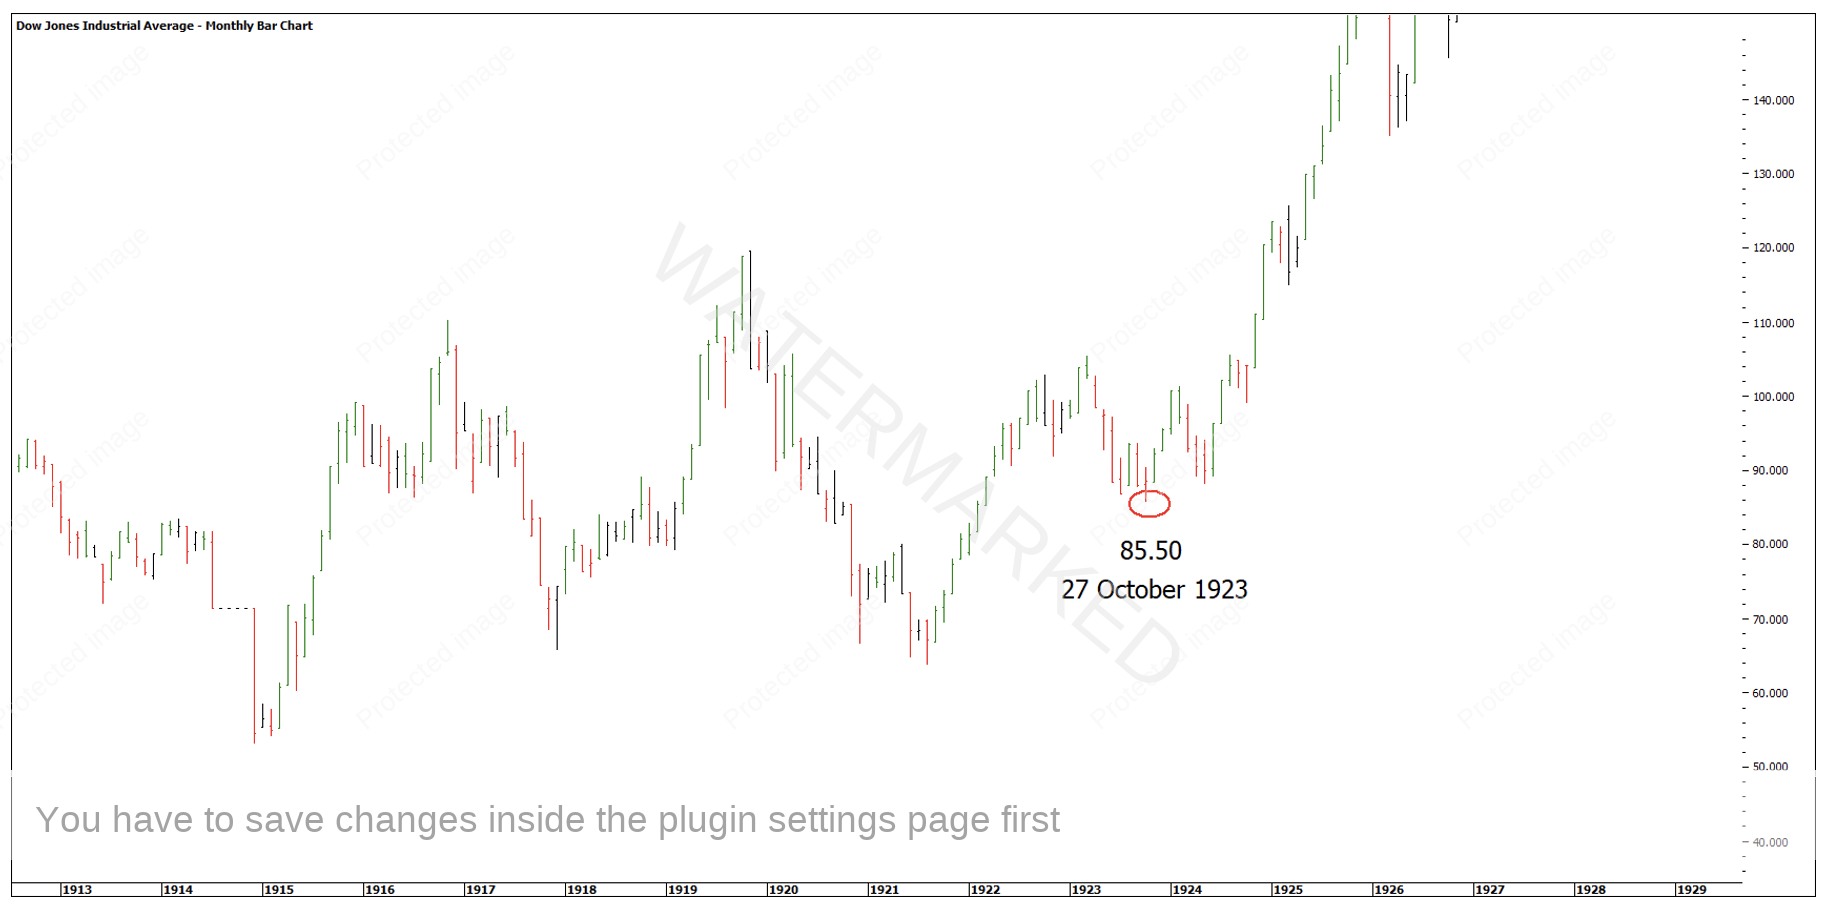
Chart 8 – Dow Jones 1923
Amazing to see exactly 100 years later to the day, we see what looks to be a major low on 27 October 2023. What followed on from 1923 was the biggest bull market of all time into the 3 September 1929 high of 386.10.
I don’t know if we will see a repeat of that, but combining cycles of 100 year, 60 years, 20 years is something David and W.D Gann discusses.
Looking at 60 years ago, there was a major bull market from 1962-1966
Looking at 20 years ago there was a major bull market from 2003 – 2007 and the GFC high.
Either way the Dow Jones is approaching the previous All Time High at an accelerated pace and the good old Christmas rally holds true!
A double top on the December seasonal date or early January, (1 year anniversary from 5 January 2022 high) could well be a short trade opportunity under W.D Gann’s rule (Rule 2). Higher bottoms on the old 5 January 2022 top would then constitute Rule 9, Buy on Higher Tops and Bottoms.
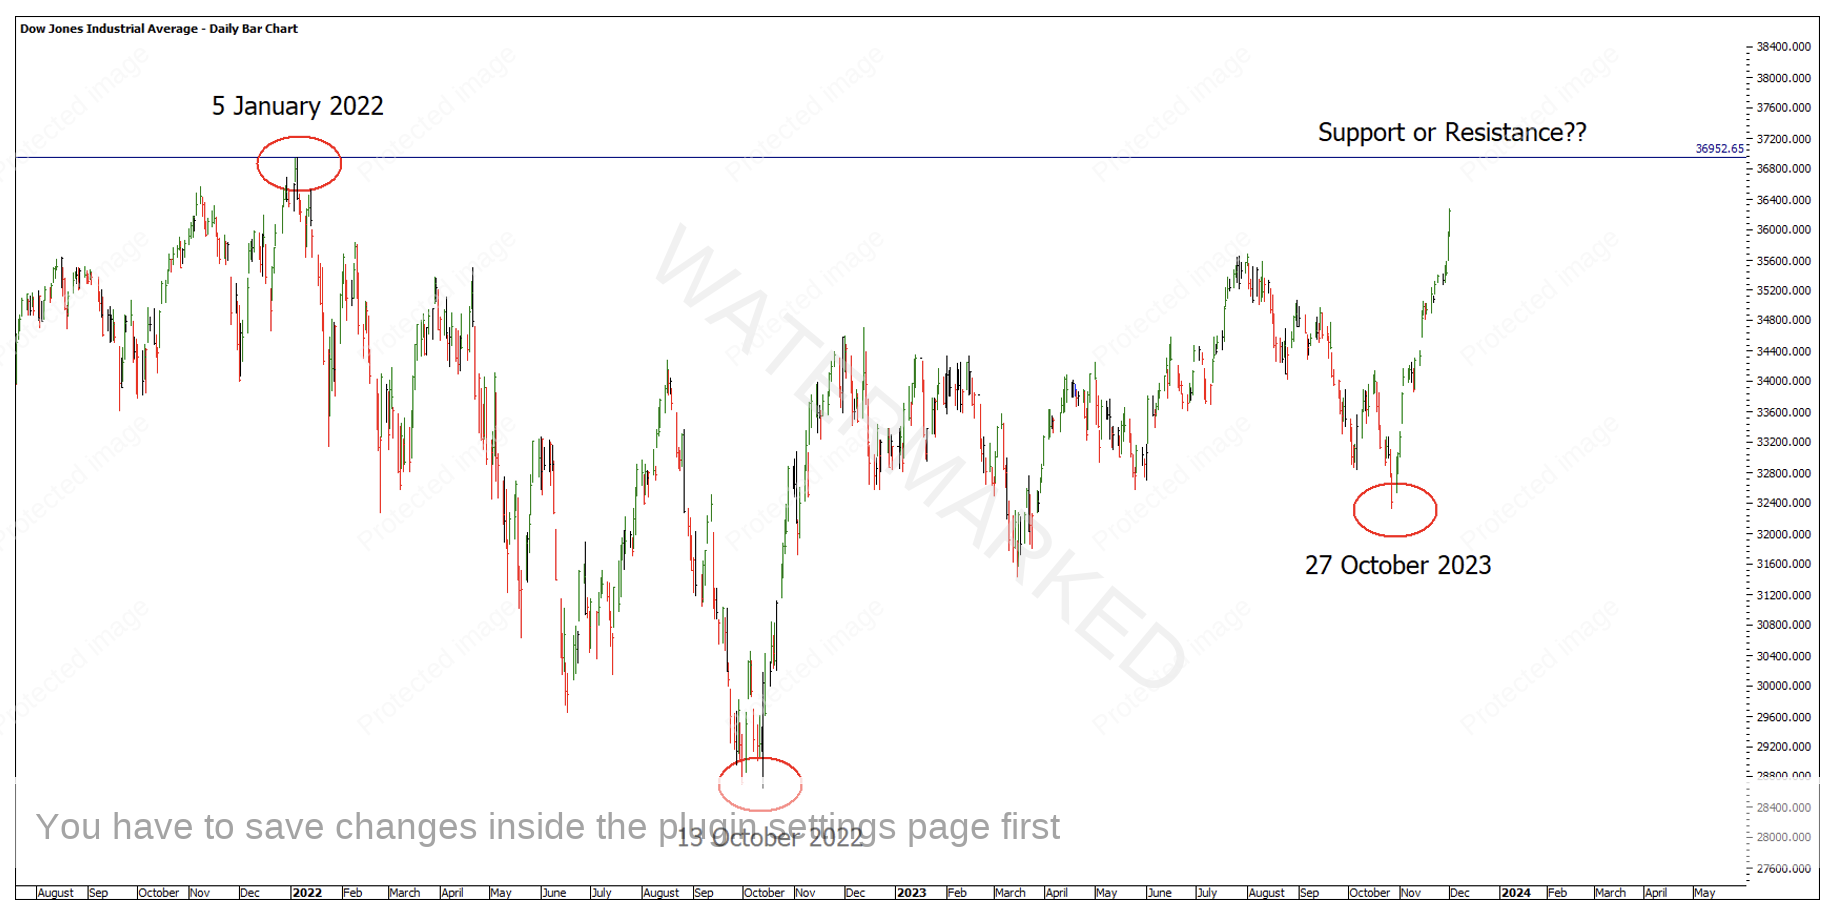
Chart 9 – Dow Jones Old Top
2024 is shaping up to be an exciting year for trading. Until then have a great Christmas break and a very happy New Year!
Happy Trading,
Gus Hingeley