Another ABC Trade Example
This month, let’s explore the Stock Index style of stop management.
For those new to the Active Trader Program, two very important parts of your foundation are the swing chart construction rules, and the ABC paper trading exercises that follow. Last month’s article gave us a reminder of this, and it did so by using a current market example, where the ABC trade was managed “Currency style”. In other words, the article was based on the trading exercise of the Eurodollar from the Smarter Starter Pack.
This month’s article is similar in that we review another current market example ABC, but slightly different in that it takes some input from the other two ABC paper trading exercises. The first was for BHP. Who can remember the first trade in that exercise? Who missed the first trade from that exercise as they began charting? This month’s article will help. It details an example of the slightly less standard swing chart entry to an ABC trade. The second exercise was for the S&P 500 stock index. And this article will use our knowledge from that exercise to manage our stops for the same current market example ABC trade.
In this article, ProfitSource will be used in Walk Thru mode to help illustrate the example. Again the trade is for the Cocoa futures market – chart symbol CO-SpotV or CO-Gann.Z in ProfitSource. The trade entry was signalled in late July of this year. We will back-test the management of this trade using the “Stock Index” style of stop management, as in the trading exercise for the S&P 500.
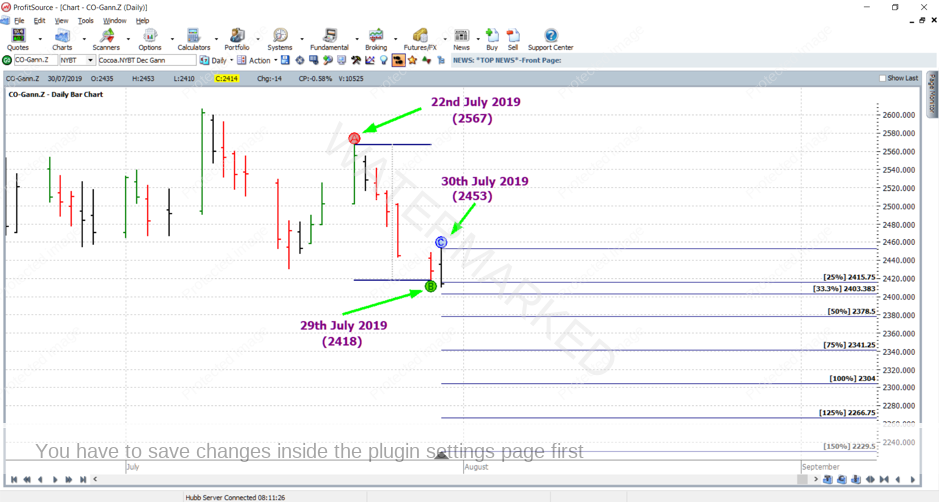
As mentioned last month, we can loosely refer to an ABC trade only by its Point C date, but I will again be thorough in this article and refer to the trade by fully stating the date and price of its points A, B and C:
Point A at 2567 22nd July 2019
Point B at 2418 29th July 2019
Point C at 2453 30th July 2019
The trade, prior to its entry, is shown in the chart below, using Walk Thru mode:
Now, before we discuss the AB reference range, milestones, etc., why are we even considering a trade here? Where is the trade signal? These are fair questions, because if you look closely enough, you will see that we don’t even have an up day to give us a Point B, and a standard ABC short trade, like the one in last month’s article, will firstly require a confirmed Point B… But, have a think about the presence of the outside day! I’ll discuss more on that further on in this article. For now, let’s determine our key parameters:
The AB reference range:
A – B = 2567 – 2418 = 149 points
As usual, we divide this reference range into quarters, thirds and halves and also work out 75% (three-quarters) of the reference range….
25% of 149 = 37.25 points
33% of 149 = 49.67 points
50% of 149 = 74.5 points
75% of 149 = 111.75 points
And obviously this is done in order to determine the milestones of the trade. Since we are managing the trade using the “Stock Index” style, let’s also allow for a very good outcome and calculate our milestones all the way to the 150% milestone:
25% milestone = Point C – 25% of the AB range = 2453 – 37.25 = 2415 (rounded down)
33% milestone = Point C – 33% of the AB range = 2453 – 49.67 = 2403 (rounded down)
50% milestone = Point C – 50% of the AB range = 2453 – 74.5 = 2379 (rounded up)
75% milestone = Point C – 75% of the AB range = 2453 – 111.75 = 2342 (rounded up)
100% milestone = Point C – 100% of the AB range = 2453 – 149 = 2304
125% milestone = Point C – 125% of the AB range = 2453 – 186.25 = 2267 (rounded up)
150% milestone = Point C – 150% of the AB range = 2453 – 223.5 = 2230 (rounded up)
The first chart in this article used the ABC Pressure Points tool to do the milestone calculations. When learning our ABCs, we do this manually, and the software can then be a good way to validate our milestone calculations.
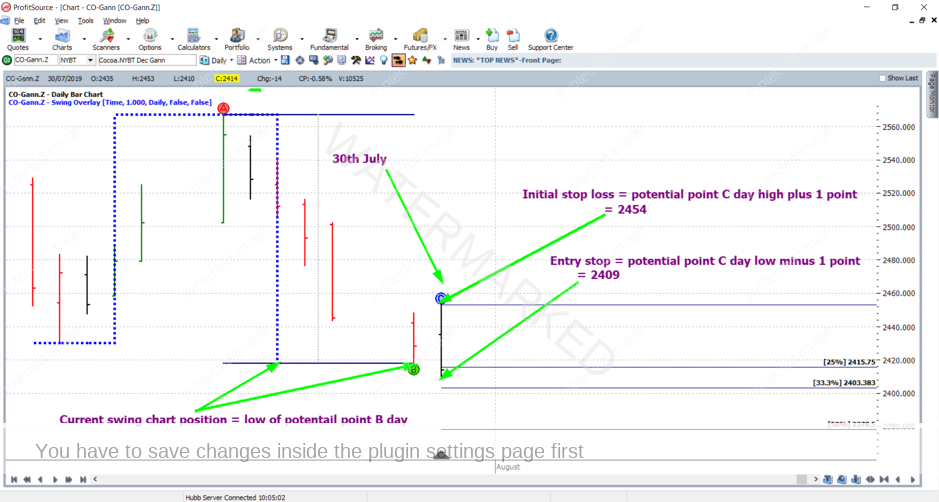
As for the entry parameters, it is here that we will closely consider the outside day mentioned earlier. Remember from our swing chart theory, that if an outside day presents itself, the first thing we do is wait for another day before putting any further swings into the swing chart. Then, if the next day is an up day or down day, this will confirm either one or two swings depending on whether the pattern is a reversal pattern, or a continuation pattern. You will see this detailed on page 81 of the latest version of the Smarter Starter Pack. In the example for this month’s article, we have the later one, that is a continuation pattern. Remember that with enough practice, our hindsight turns into foresight. So, after the occurrence of the outside day on 30 July, we would anticipate that a down day on the 31st would confirm two swings on the chart simultaneously – one swing for Point B, and the other for our Point C – i.e. entry into the trade as the low of the 30th is taken out during a down day on the 31st.
I have zoomed in on the chart below to illustrate how things would look prior to a potential entry day on the 31st if the 31st is to be a down day. Shown also are the entry and stop loss orders we would have in place, with this anticipation. In the chart below I’ve also placed on the Swing Overlay (set to daily resolution), which shows that, prior to entry, the swing chart still only sits in line with the low of our potential Point B:
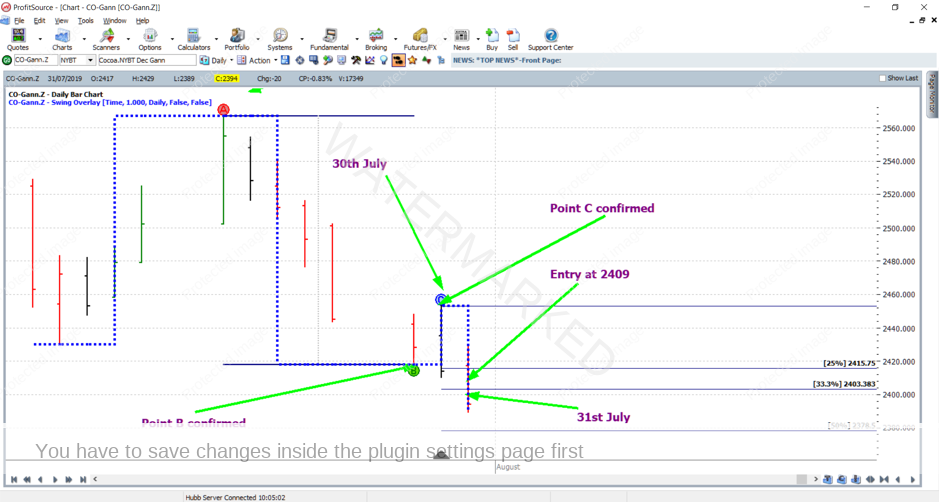
And then it happens. The 31st is a down day, we enter the trade at 2409 as the low of the 30th is taken out by one point lower than 2410, and Points B and C are confirmed simultaneously. The swing overlay helps to illustrate this in the chart below. It’s a much more dynamic process than the very standard ABC trade from last month’s article!
Still hanging in there? If so, you’ve proven that you have a very good understanding of the Smarter Starter Pack, and the rest of this article should be easier to grasp.
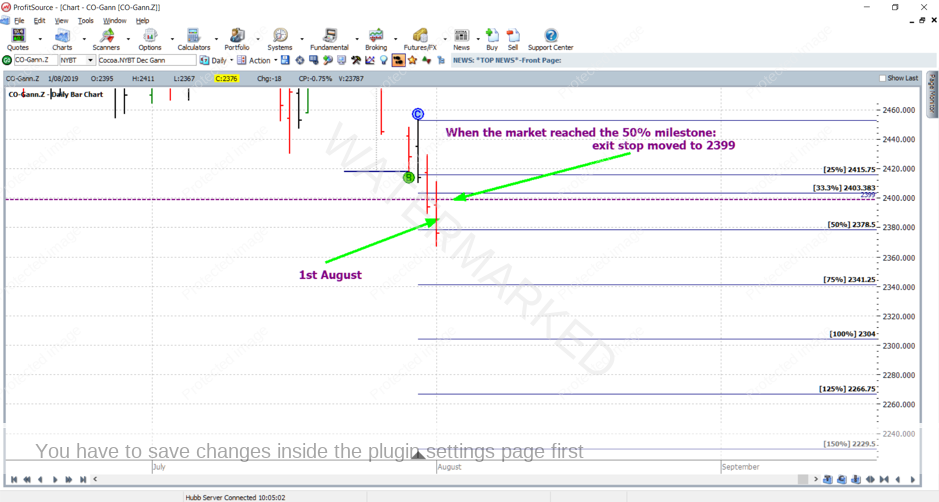
Now what about the trade management, and an exit target? As you will remember from the S&P 500 exercise, we will not set an initial exit target. What we will do is trail our exit stop above milestones as they are reached. This can allow us to take advantage of a strong move that happens very quickly, and lock in profits as they are given by the market.
We will move stops to one-third of the average daily range (in this case I have used approximately one-third of the average range of the last 60 daily trading bars), which is 20 points, above each of the milestones as they are reached. So when the market reached the 50% milestone on the 1st of August, we would have moved our exit stop from C+1 (2454) to 2379 (50% milestone) + 20 points = 2399, initially locking in some profit. This is illustrated below:
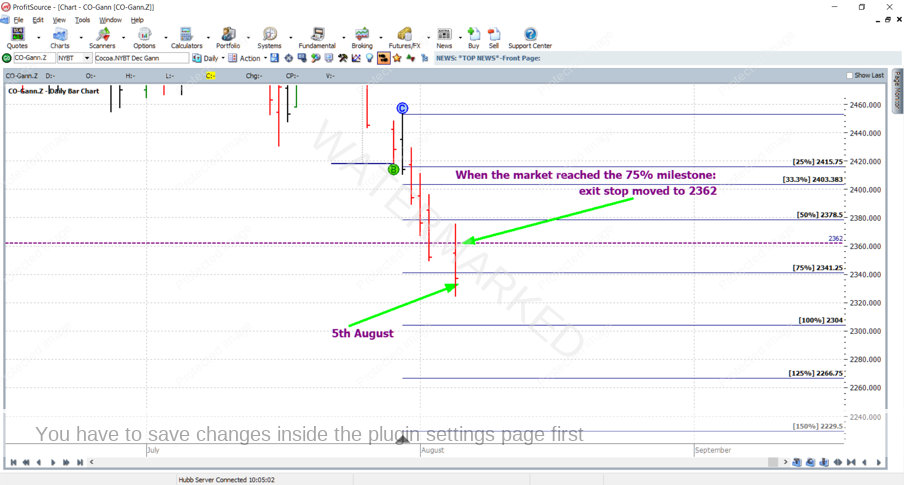
And using ProfitSource in Walk Thru mode, let’s see how this trade further panned out…. On the 5th of August, the market reached the 75% milestone, so we would move our exit stop to 2342 (75% milestone) + 20 points = 2362, locking in more profit. This is illustrated below:
On the 6th of August, the market reached the 100% milestone, so we would move our exit stop to 2304 (100% milestone) + 20 points = 2324, locking in even more profit. This is illustrated below:

On the 7th of August, the market reached the 125% milestone, so we would move our exit stop to 2267 (125% milestone) + 20 points = 2287, locking in more profit. This is illustrated below:

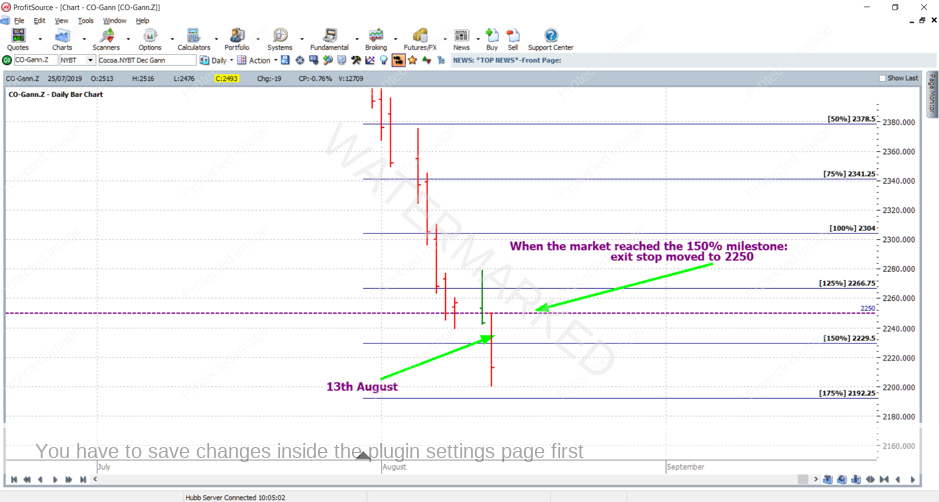
On the 13th of August, the market reached the 150% milestone, so we would move our exit stop to 2230 (150% milestone) + 20 points = 2250, locking in more profit. This is illustrated below:
But the trade now goes even further, reaching the 175% milestone. A very nice trade, and you would by this point have the good problem of making sure that you also calculated the 175% milestone. This was reached on the 14th of August, and we would have moved our exit stop to 2193 (175% milestone) + 20 points = 2213; notice on this day, that the market rallied slightly, hitting our exit stop at 2213 for the trade exit, as shown in the chart below:

Here is the final profit calculation for the trade:
Entry = 2409
Exit = 2213
Profit = 196 points (196 x $10USD = $1,960USD)
Also as mentioned in last month’s article, a few specs about Cocoa futures:
- Traded through the Intercontinental Exchange (the “ICE”),
- Trading hours are 4.45AM to 1.30PM New York Time.
- Each point of price movement changes the value of one contract by $10 USD.
- The current initial margin is $2090 USD
Currently the December 2019 contract is trading at the highest volume. For those still wishing to access this market with much lower margin, it can be traded using CFDs.
Hopefully you have enjoyed this article. Once again, like last month’s article, its goal was to determine in detail what you do or don’t know about your Active Trader Program foundations. If there are any questions which arise after reading this article, please always feel free to email us at tradingtutors@safetyinthemarket.com.au
Work Hard, work smart!
Andrew Baraniak
P.S. There were a couple of typos which I let slip through in last month’s article. Where it says:
50% milestone = Point C – 25% of the AB range = 2538 – 99 = 2439
75% milestone = Point C – 25% of the AB range = 2538 – 148.4 = 2390 (rounded up)
It should instead say:
50% milestone = Point C – 50% of the AB range = 2538 – 99 = 2439
75% milestone = Point C – 75% of the AB range = 2538 – 148.4 = 2390 (rounded up)
Apologies if this has caused any confusion!