Better than Christmas
Welcome to March, the month of the year that fills me with excitement when it comes to my market of choice. If I look at my own history of success and experience, this month delivers in spades as it has been a source of success on Crude Oil. Gann spoke about personal cycles, and for whatever reason the month of March into April has aligned the oil market and my analysis skills to deliver trading outcomes. That is why as this month rolls around each year, my mind sharpens with an expectation that 2024 is no different.
A quick back drop to the broader sentiment in markets and economies. We heard recently from the RBA in Australia that inflation is starting to drop to levels that are more normalised after we saw the post Covid blowout. This is worthwhile understanding as commodities generally enjoy a high inflation environment and underlying changes are worthwhile monitoring. An area we can see this is in the value of the US dollar. In Chart 1 below I have included the Dollar Index (DX-Spotv in ProfitSource) to highlight the current price action. I have run a Ranges Resistance Card over two recent ranges, with the 50% level marked on both and the price action showing some potential support.
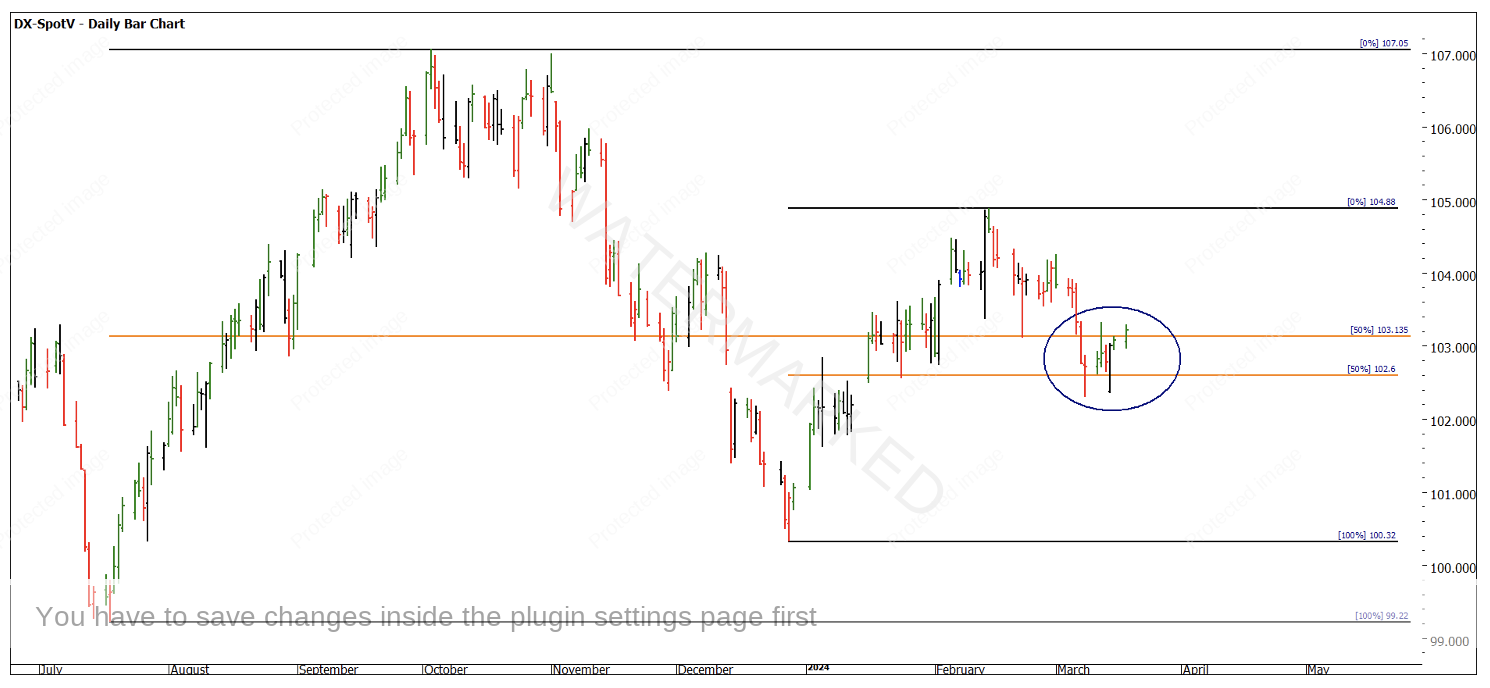
Chart 1 – Daily Bar Chart DX-SpotV
The correlation is simple, a rising US dollar would likely put pressure on the oil price.
It’s no surprise that March is exciting for me and much of that has to do with seasonal time. This concept that Gann, David, and I have written about and discussed so frequently is for many one of the first attempts at using time-based analysis. In Chart 2 we see the oil price with some day counts and a seasonal time framework placed over the last 12 months or so. We can see the decline into the December low and the drive to the upside has not been overly strong. We have travelled over 100% in time compared to the previous range but only now are we seeing 50% in price.
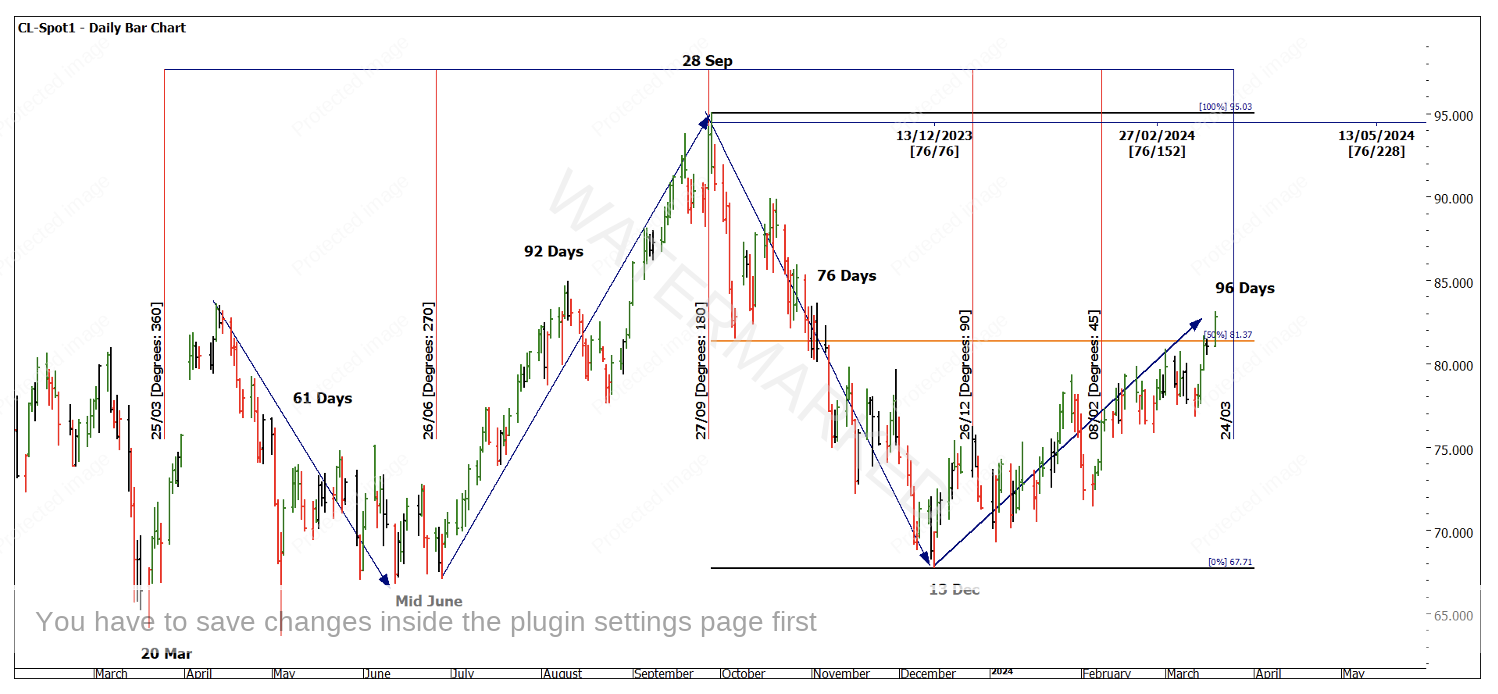
Chart 2 – Daily Bar Chart CL-Spot1
As with any opportunities we seek time and price alignment, some volatility running into that area, the right position and then a pattern or signal for action. We have a number of those elements and some patience over the next week may allow for a signal.
Clearly, we are not looking for cycle highs or lows, any opportunity here could be a more shorter-term setup. This time of year is also worth remembering as the Birth of Contract which is 30 March 1983.
We have discussed in previous articles how a bigger picture cycle could be in play (see previous articles) and we have given this market time to base and get moving forward and to date it has been lack-lustre, this is why it’s important to have a plan B and also look for a change in cycle. I have been watching the time frames in Chart 2 as a guide.
The Balance Time Tool allows us to measure a range in Time and project it forward. The top to bottom time frame was 322 days which is (2 x 161). If we balance time we get 23 March 2024.
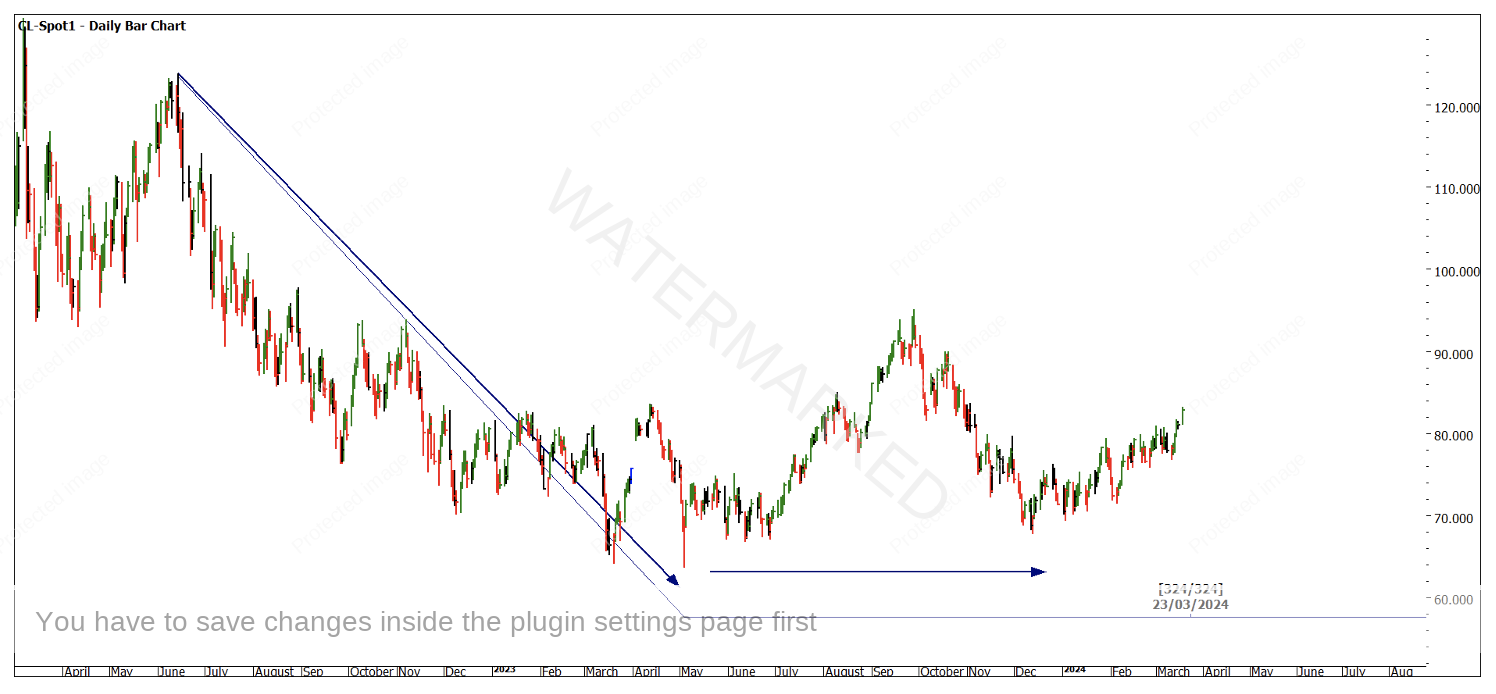
Chart 3 – Daily Bar Chart CL-Spot1
The recent bullish price action and jump in prices may provide the volatility component element we need and of course there are other Time and Price elements that we can layer for confirmation.
The last chart I will leave you with is watching the 50% of Price off the previous range to repeat, this price aligns with the April 2023 high.
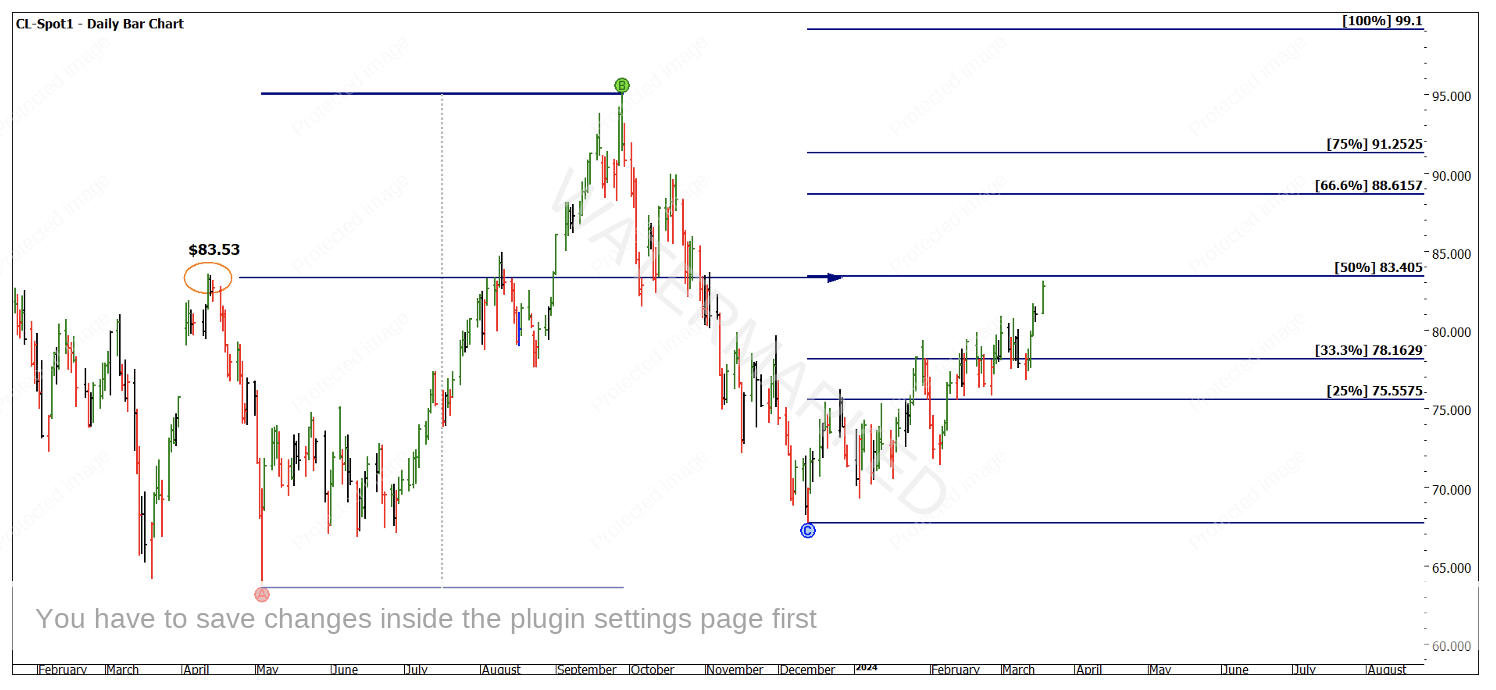
Chart 4 – Daily Bar Chart CL-Spot1
This market has the ability to false break levels of importance and change direction, the price of $80.56 is one that would be a good alignment for any prices above that 50% level.
If any runs unfold, they can often be fast and short in time but a strong percentage move, you should study previous moves from the March seasonal time into April.
Good Trading
Aaron Lynch