Bottoms Up
Welcome to 2022! Carrying the discussion over from December article Jolly Good Top on the Bitcoin market (ProfitSource Code: FXBCUS), we can confirm that Gann’s methodology still works on today’s markets. This goes for even the cryptocurrencies which were non-existent back in the early 1900’s. It is also a great example of a market of perceived value, illustrating that with price data the Gann methodology can be applied to any market with enough volume.
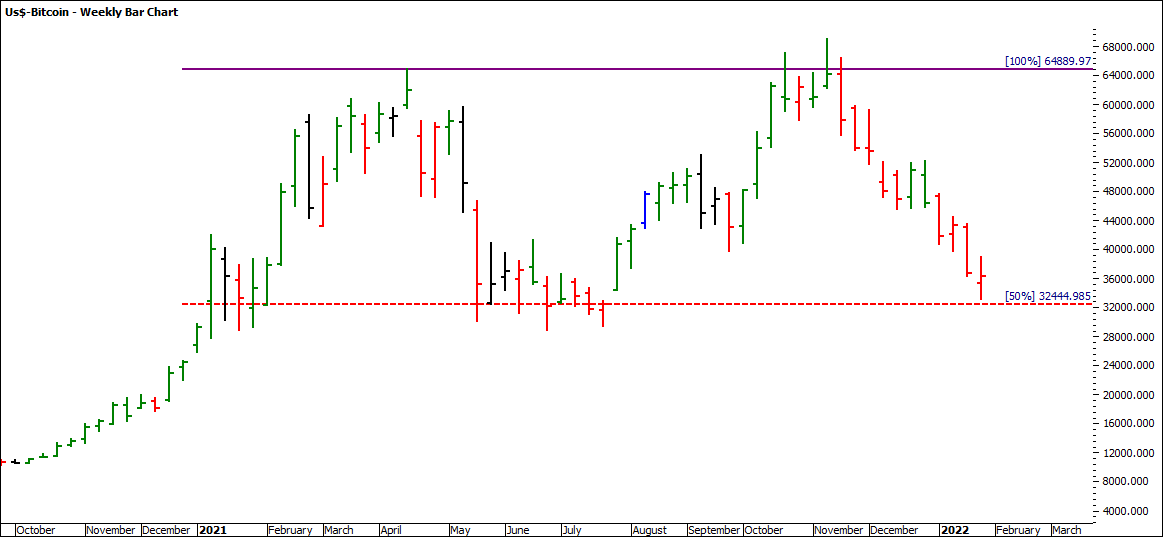
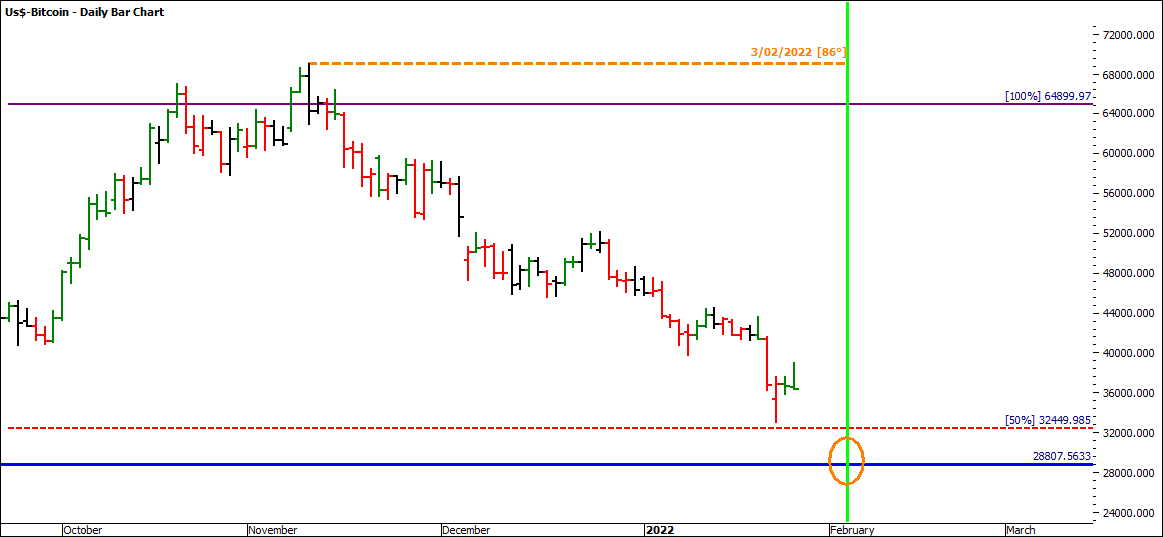
This month’s article will continue to review a series of price, time and form reading techniques on Bitcoin as it approaches previous 50% Resistance levels. The double top has fallen straight back to the All-Time High 50% level at 32,449.98.
The ATH came in at April 2021 at 64,899.97. The market naturally fell to the 50% level at 32,449.99 in May 2021, finding support consecutively prior to re-testing the ATH. As you will notice, as the market came and retested this level it failed three times before it retested the ATH.
At this stage the market has fallen to re-test the support at these levels but has not yet hit the 50% level. Watching the weekly closes around this resistance level will provide a good indication to how the market reacts.
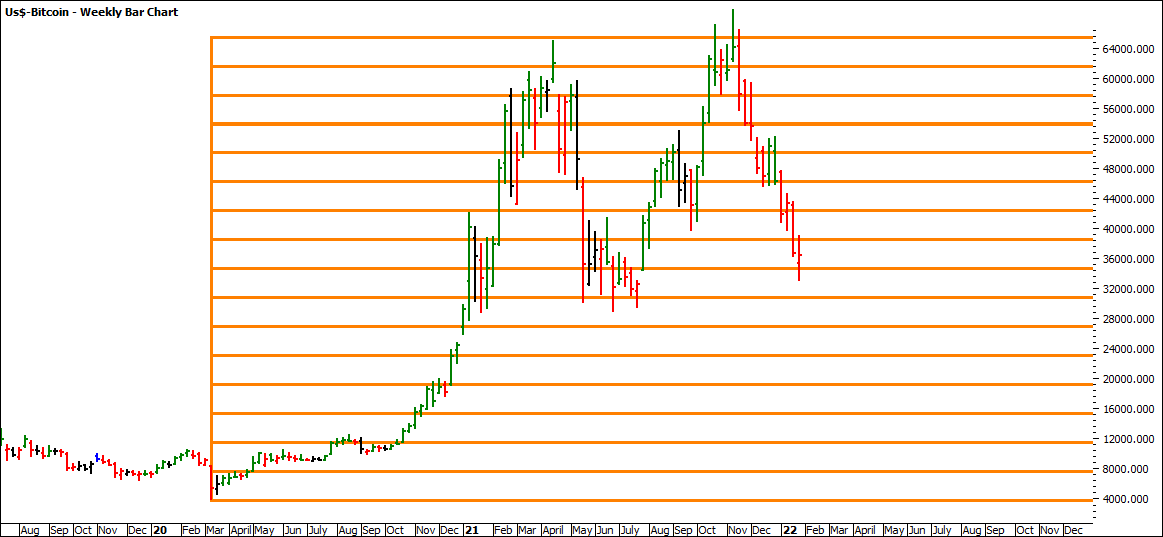
As you can see from the 2020 Lows Resistance Card that we applied last month, the market has currently respected the 100% multiples, however it does not supply enough information, and therefore more confidence will come from using the Lows Resistance Card as additional confirmation.
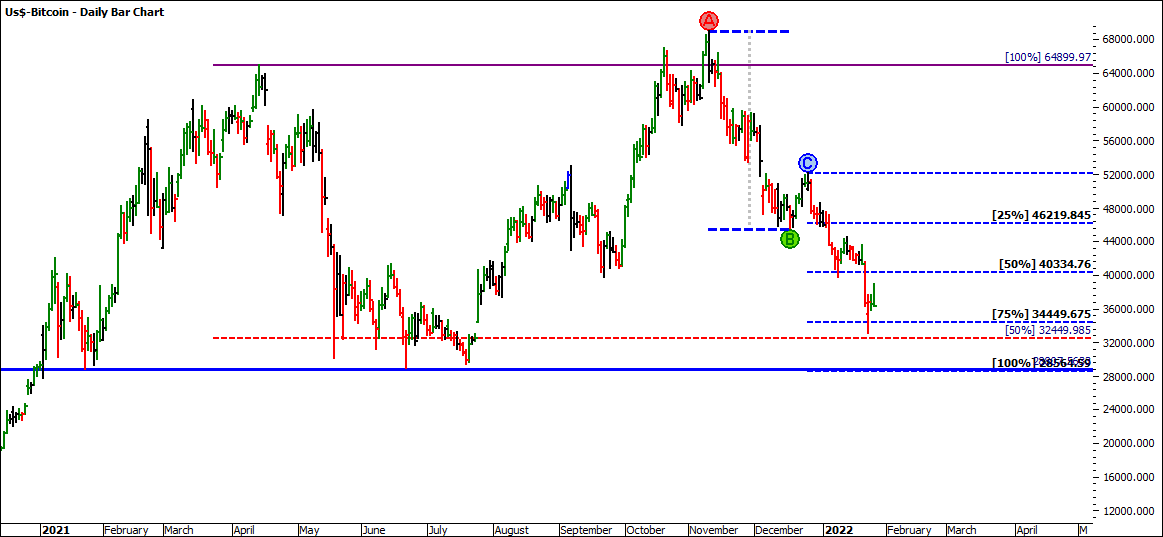
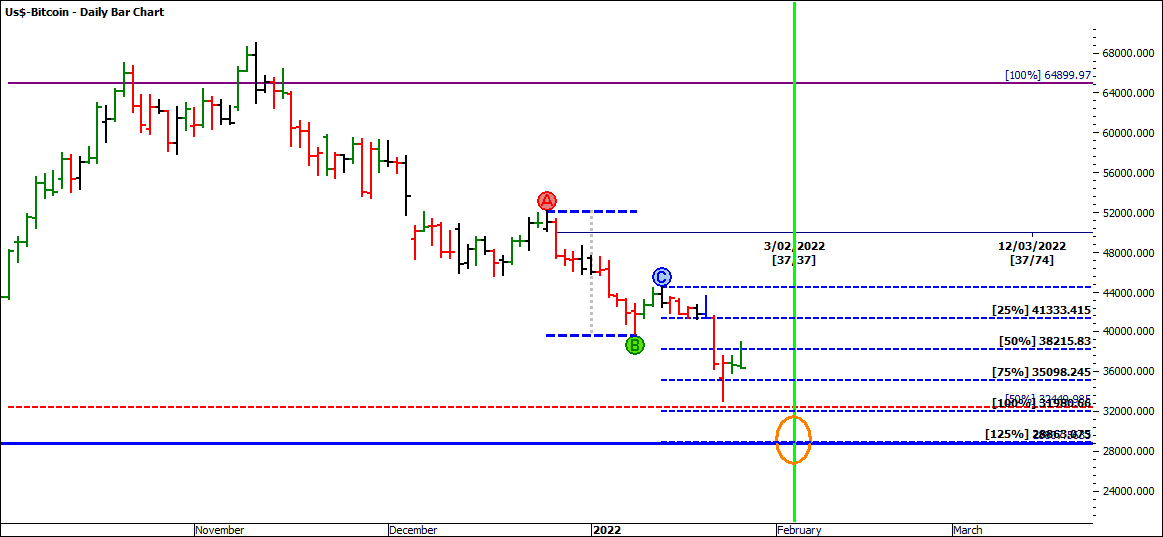
Applying the ABC Milestone Tool, we can see that the AB Range from November/December 2021 is 23,540. This range projected forward from the 27th of December high at 52,104 projects the 100% level to 28,569. As previously mentioned, the market has not yet officially tested or broken the 50% level at the time of writing (27th of January 2022). It will definitely be worth watching the 50% level before we get excited about the 100% level.
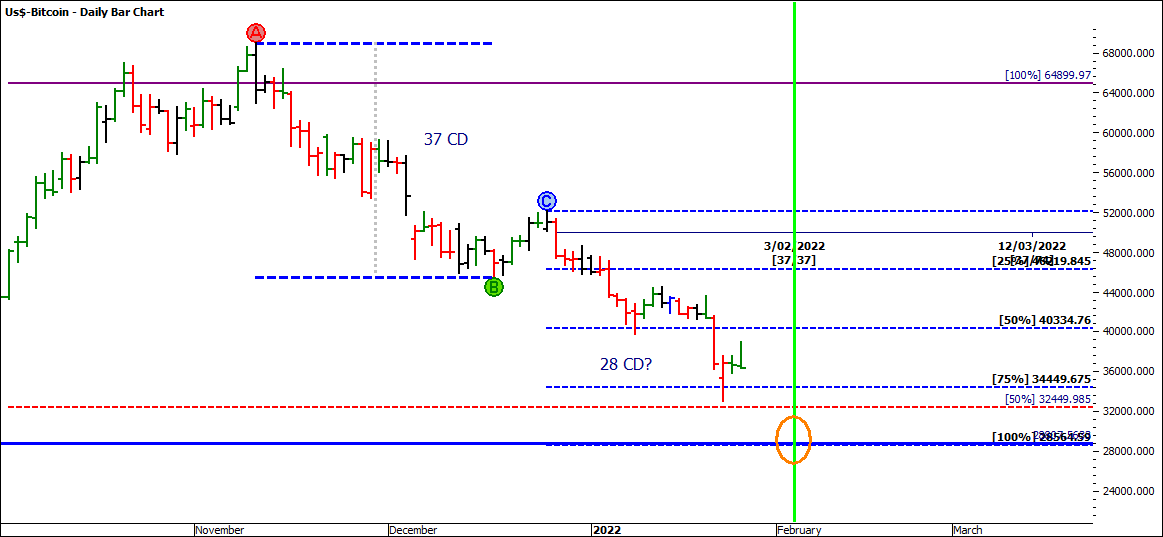
Exploring this scenario further, in the same AB Range period the market did 37 calendar days. The current market sits at 28 calendar days, though projecting 37 calendar days brings the 100% repeat in time to Thursday the 3rd of February 2022 as per the green vertical line.
Refining the ABC milestones to a smaller timeframe, focusing on the 27th of December 2021 to the 10th of January 2022 is an AB range of 12,470. Projecting this from Point C on the 13th of January 2022 at 44,451 the projected 100% milestones comes out at 31,980 which clusters with the HRC 50% level. 125% clusters with the ‘forecasted’ level.
Lastly, if we apply Time by Degrees, you will see that our projected target date on the 3rd of February 2022 is 86 degrees from the previous top on the 10th of November 2022. This date is also close to the seasonal date. I am not suggesting that the market will turn on this date, but more so that it’s an area to watch the market.
It’s Your Perception
Robert Steer
