Jolly Good Top
Just like that, it is the end of another yearly cycle! I don’t know about you, but whether it be the new standard of living, COVID-19 or our economic system,for some traders there sure have been plenty of opportunities to prosper this year.
This year also showed more market interest in cryptocurrencies, and not to mention more so-called ‘experts’ in the space. David talked about the bragging fund managers and said that more often than not, their stellar results were mainly because they had found a good bull market. With this in mind, this month’s article is on Bitcoin.
If we turn our attention to the Bitcoin market (ProfitSource Code: FXBCUS), we can explore the market-leading into what might be a ‘Jolly Good Top’ through a series of patterns. Through a combination of price, time and form reading, the double top was recognizable.
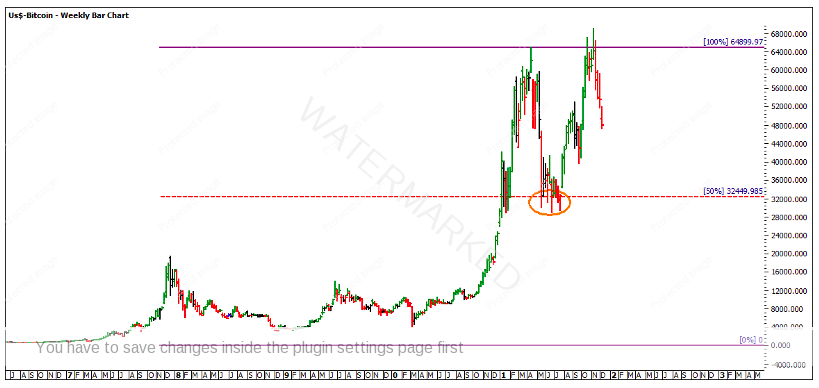
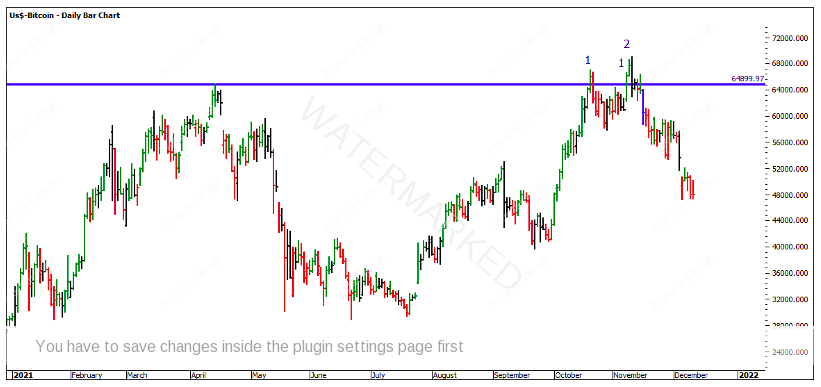
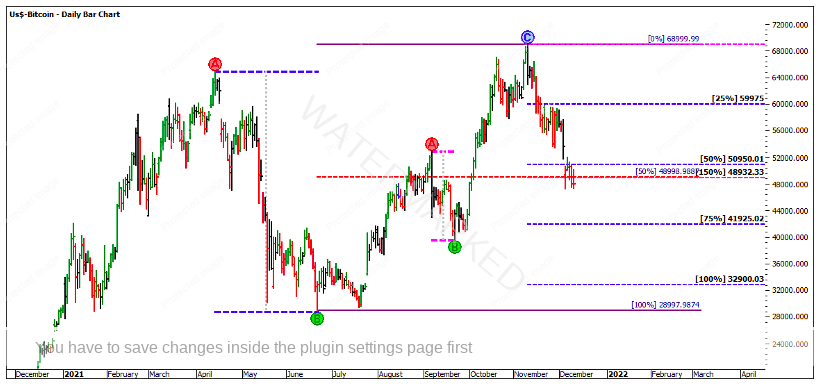
Taking a step back to understand the position of the market prior to the top being made, the All-Time-High came in during April 2021 at 64,899.97. The market naturally fell to the 50% level at 32,449.99, finding support consecutively prior to retesting the ATH. As you will notice, as the market came and retested this level it failed twice trying to close above the ATH. We will look at this in more depth later in the article.
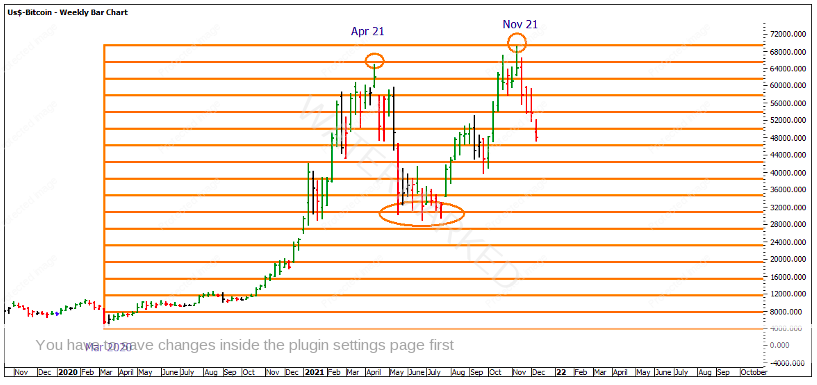
Applying a Lows Resistance Card to the March 2020 low, the market was about to produce a top on 16 multiples in April 2021 and then 17 multiples of the March 2020 low in November 2021.
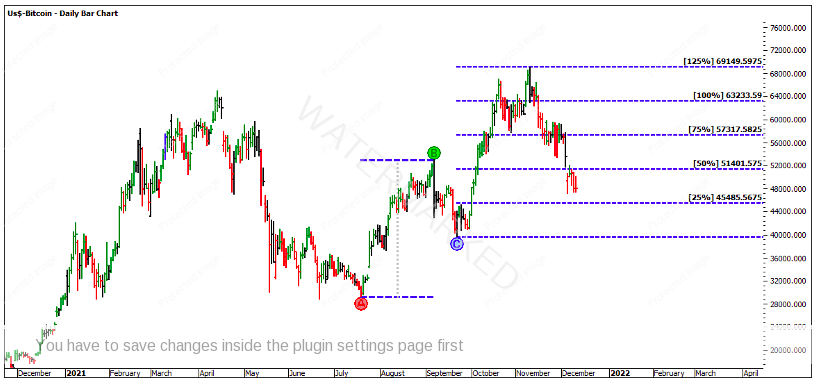
Once the market found support on the 50% level, it was able to push out of the newly found lows. As you can see the AB range was able to repeat 100%. It went on to 125% to take out the previous ATH.
Some would see this as a potential strengthening market, as the 2nd section is greater than the 1st section. Technically, this is correct, but it also pays to watch the subtle signs of the market as an outside day reversal happened on the day it hit 125%.
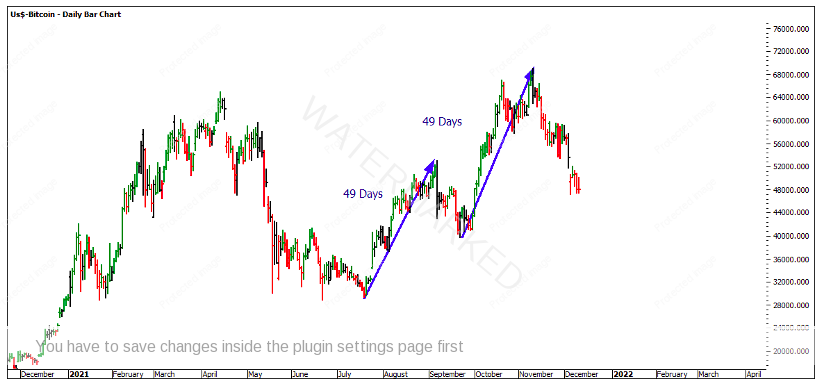
Interestingly enough, while price exceeded in the 2nd section, remember that time is more important than price. The 1st section was 49 days up, and the 2nd section was a repeat of 49 days, so we saw a 100% repeat in time, giving more confidence for the top.
You will also note that the July low is being used, as that is when the market started to trend.
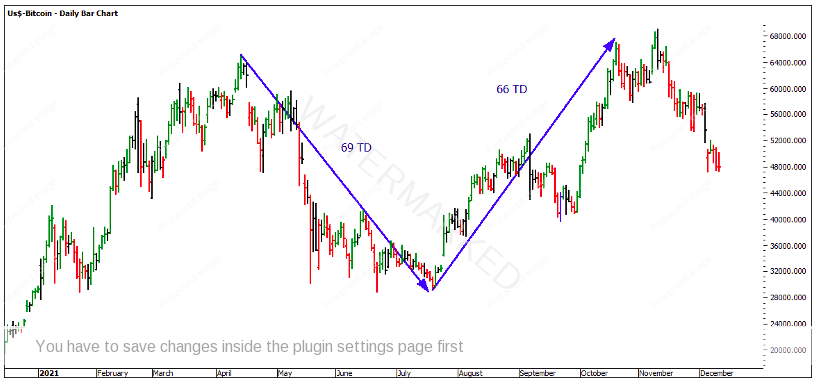
Turning to the Trading Days, you’ll see there is also a similar pattern between the tops with 69 trading days down and 66 trading days up, although this was the first top in October that broke into the fresh ATH’s, being the nominated date, with the physical date coming in November 2021.
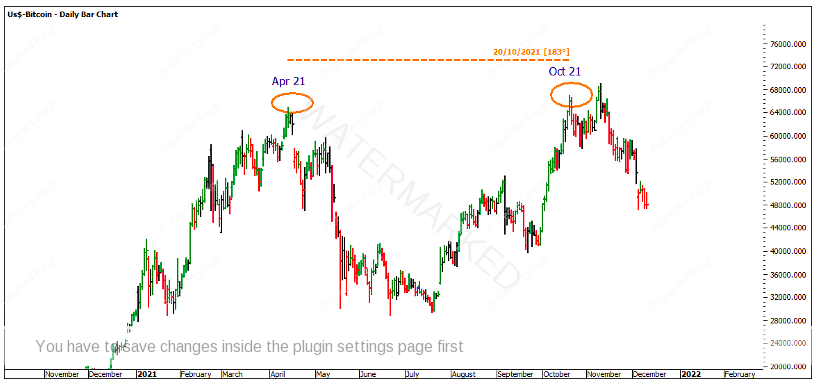
Using Time by Degrees we see that the distance between the April 2021 top and the October 2021 top was 183 degrees. At this point, there was enough going for the top, which gave us enough confidence to see that there was likely to be a turn in the market.
From a form reading perspective, you will note that on the daily bar chart, the market failed to close above the April 2021 high more than three consecutive times. The first time in October 2021 it was able to only close once, and then again in November 2021 it was able to close above twice but this was shortly lived and an outside reversal day followed.
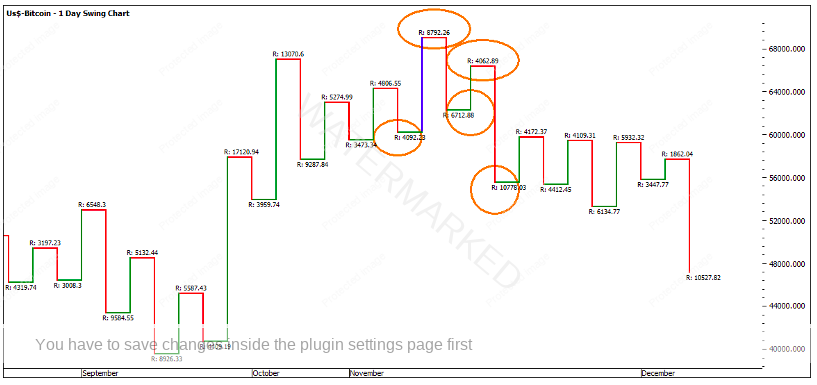
Turning to the Swing Charts, you will also note that the down swings were expanding and the up swings were contracting.
The big question is where to from here?
Currently (at the time of writing) the market has overbalanced both time and price. The market has moved 26 days lower, compared to 15 days prior. It has also been down 150% in price compared to the pull back after the 1st section. Currently, there doesn’t seem to be too much interest from the bulls, with the market only being able to show 1-day pullbacks within the down move.
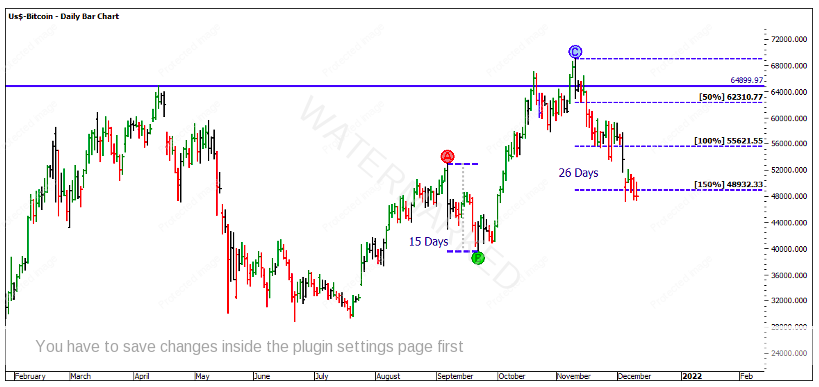
In saying that, we have also seen the market find some more recent support at 50% of the total move. This 50% level clusters with the price milestones. We may see a short-lived correction prior to breaking this level if the market has further to go.
Remember that a market can run up to 200% of the AB range after a double top or bottom so this is a worthwhile market to keep an eye on.
As always, I would like to say a huge thank you to YOU! The many in the community who read the newsletter and are involved with Safety in the Market, you are on the road to a very prosperous destination!. I wish you all a very healthy and wealthy festive season and I look forward to hearing all the grand successes in the new year.
It’s Your Perception
Robert Steer