Can You Double?
Two months on from the last Platinum Newsletter and we’ve seen the US indices, the Dow Jones, Nasdaq and S&P500 continue their strong moves from the October 2023 low and trading into new all-time high territory.
The SPI200 is just holding its nose above all-time highs, and the FTSE100 has continued its sideways shuffle, albeit with a series of higher monthly swing bottoms. The Nikkie225 has been showing a very strong trend up whilst the DJ China is showing a strong trend down!
There are always plenty of trading opportunities across such a vast spread of markets. What sort of setups we target and what kind of Risk to Reward Ratio we strive to achieve is something that will differ for everyone. One challenge is to make trading as simple as possible.
A question I propose to everyone is, would you be successful if you doubled your trading account every year? Regardless of all the stories you’ve heard about other great traders, for most people doubling your account year on year would be a significant achievement.
Now you could achieve this outcome by risking 5% of your capital per trade and banking two 10 to 1 Reward to Risk Ratio trades. That would double your account every year. Just two trades!
For example, starting with a $10,000 trading account.
10,000 x 0.05 = $500 risk per trade.
500 x 10 = $5,000
$5,000 x 2 = $10,000
I know the above calculation doesn’t take into consideration any losses, but does it at least reduce the stress of feeling like you have to be in the market all of the time? In David Bowden’s Master Forecasting Course, he says that “the biggest advantage you’ve got as a trader is that you DON’T need to be in the market all of the time.” He goes on to say that too few traders take advantage of this fact.
Potentially you could target two 12 to 1 RRR trades for the year which would allow 2 losses per trade and still achieve a doubling of your account.
Warren Buffett’s first rule of investing was ‘Never lose money’. That might be impossible to achieve in trading as even the best like W.D. Gann had losing trades. However, drastically reducing your number of entries and losses, so that each good trade keeps you well in profit, may just be the difference between a great year or a terrible one.
One setup that might be worth following is on Gold. That’s because Gold could be in a monthly First Range Out of a second quarterly section. See Chart 1 below.
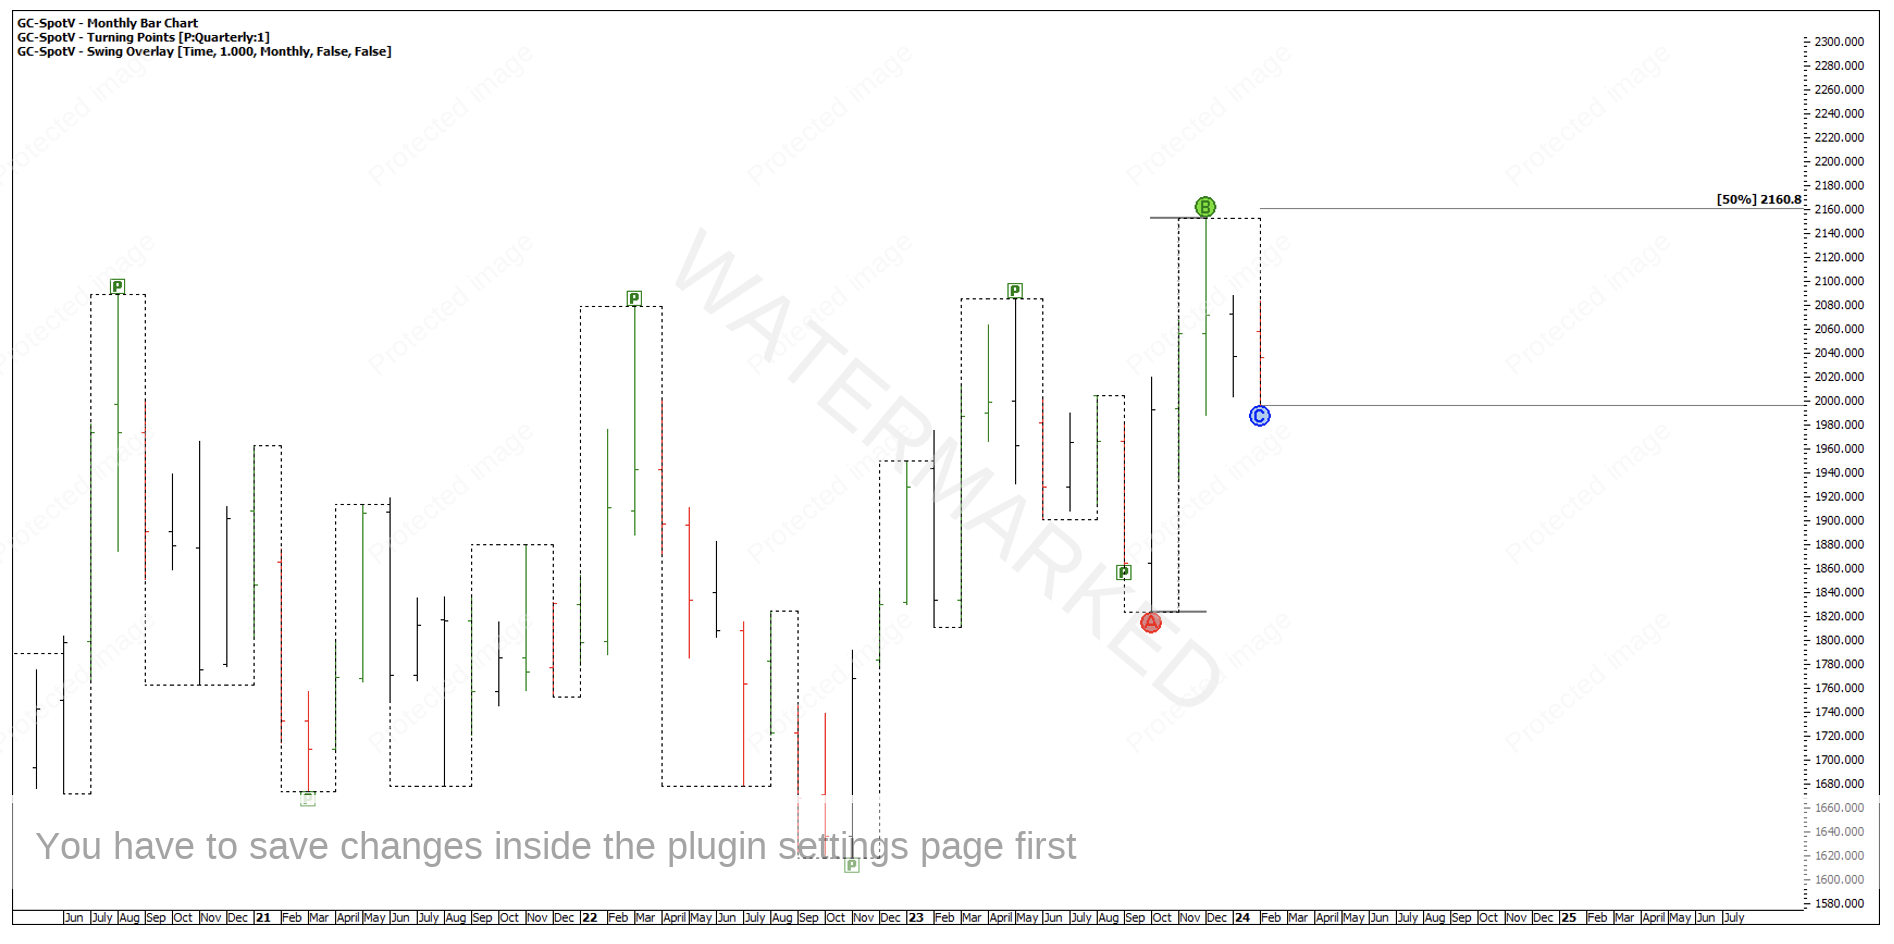
Chart 1 – Gold Monthly First Range Out
On the continuous chart, Gold looks to be setting up for a repeating weekly range into a 50% retracement and double bottom.
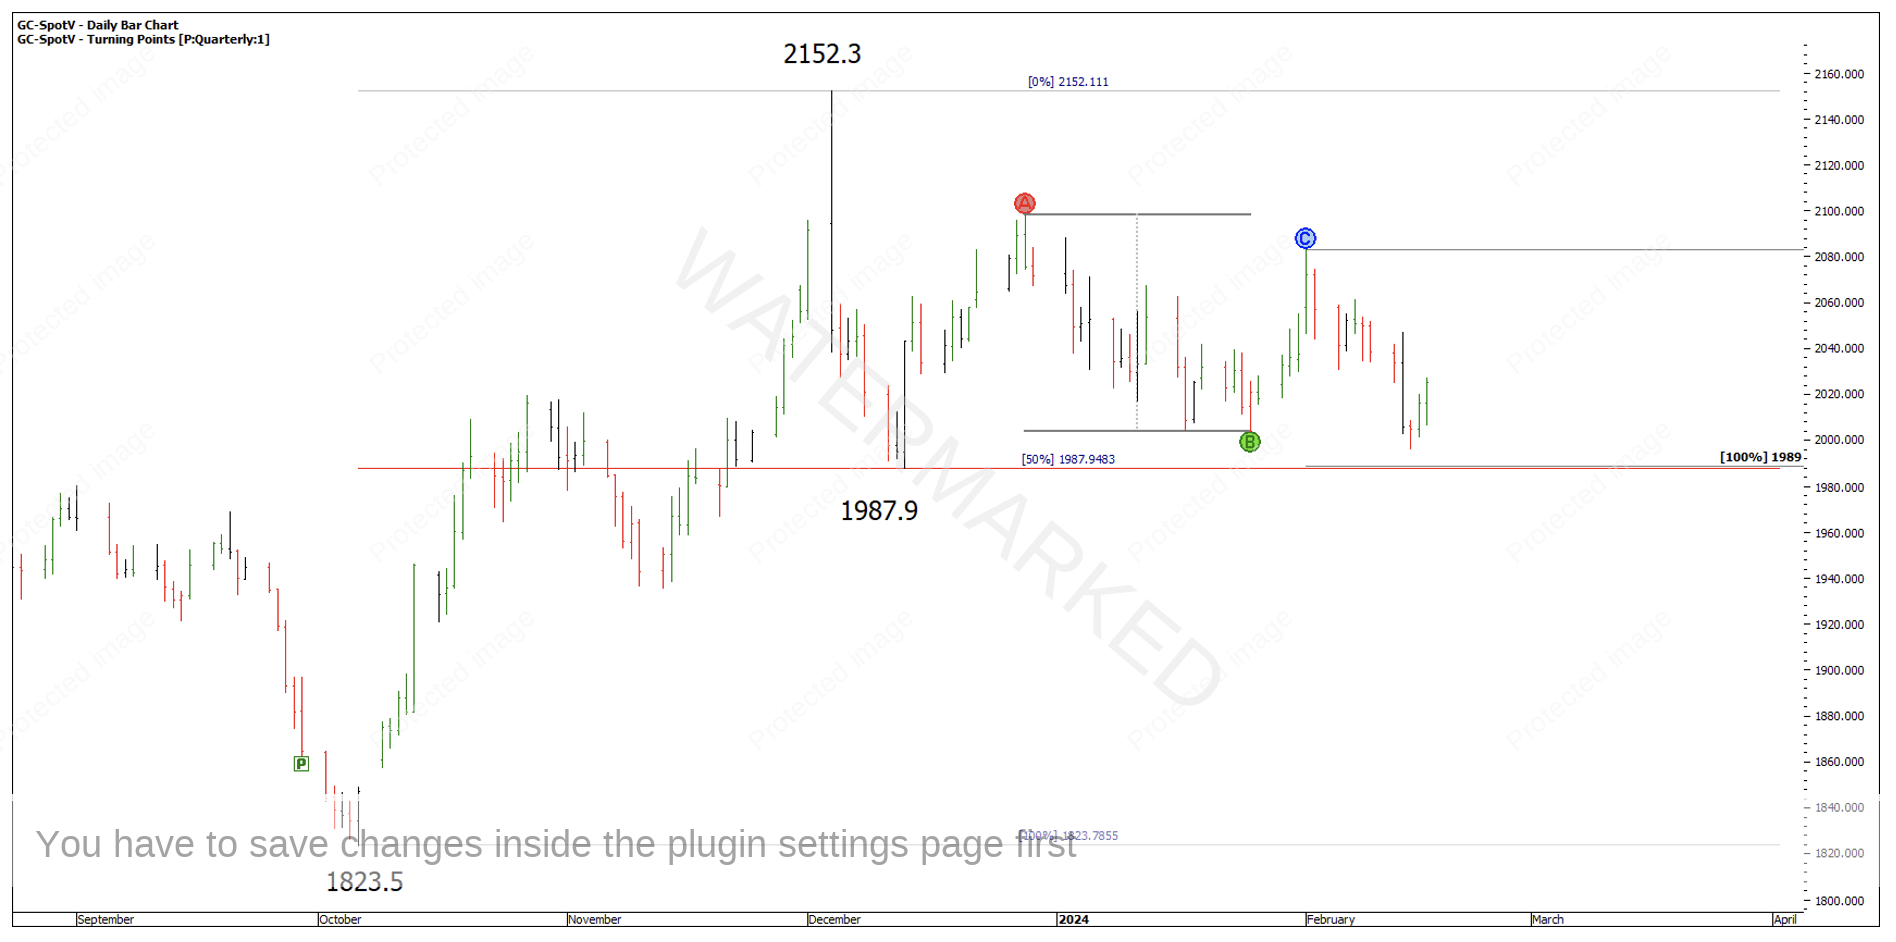
Chart 2 – Double Bottom Setup
However, on the April contract month (GC-2024.J) which shows the highest volume, the false break double bottom on a 50% retracement has already occurred and is on a clear 30 degree vibration. On top of that, the monthly swing down is roughly 50% in time of the previous monthly swing down.
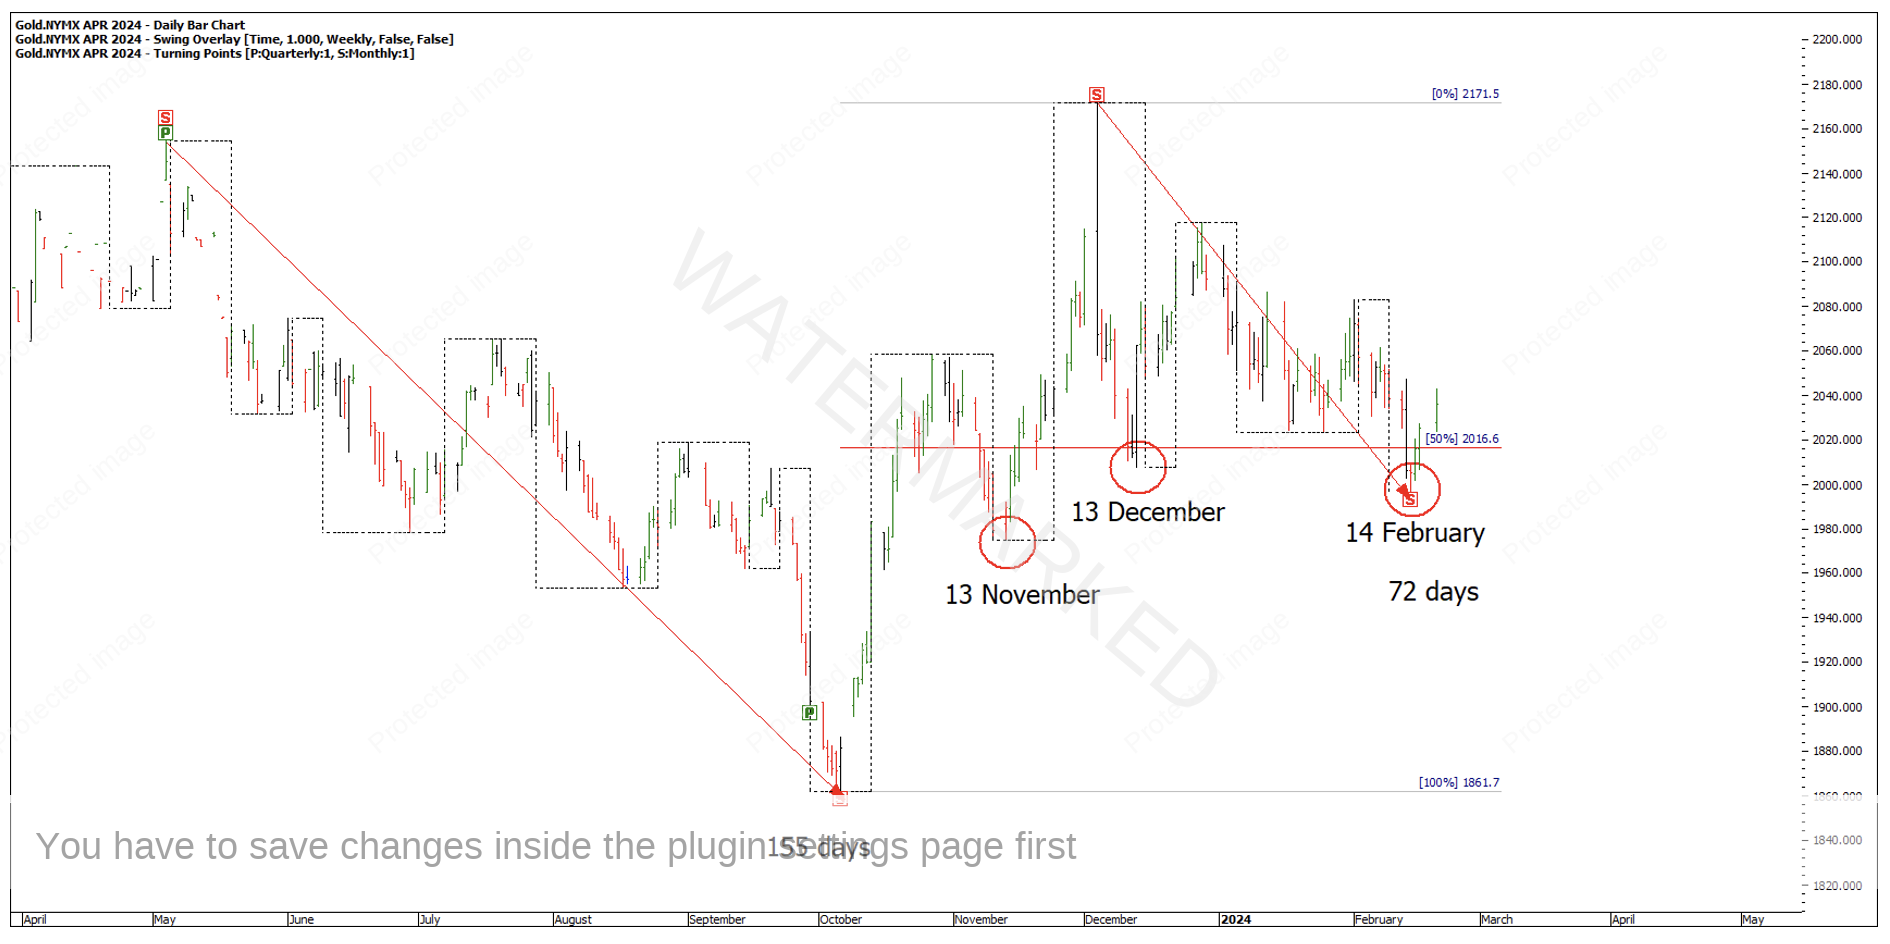
Chart 3 – Contract Month Double Bottoms
For a little bit of form reading, there are two contracting weekly swing ranges down with the last weekly swing 50% in time of the previous swing and a clear harmony of numbers.
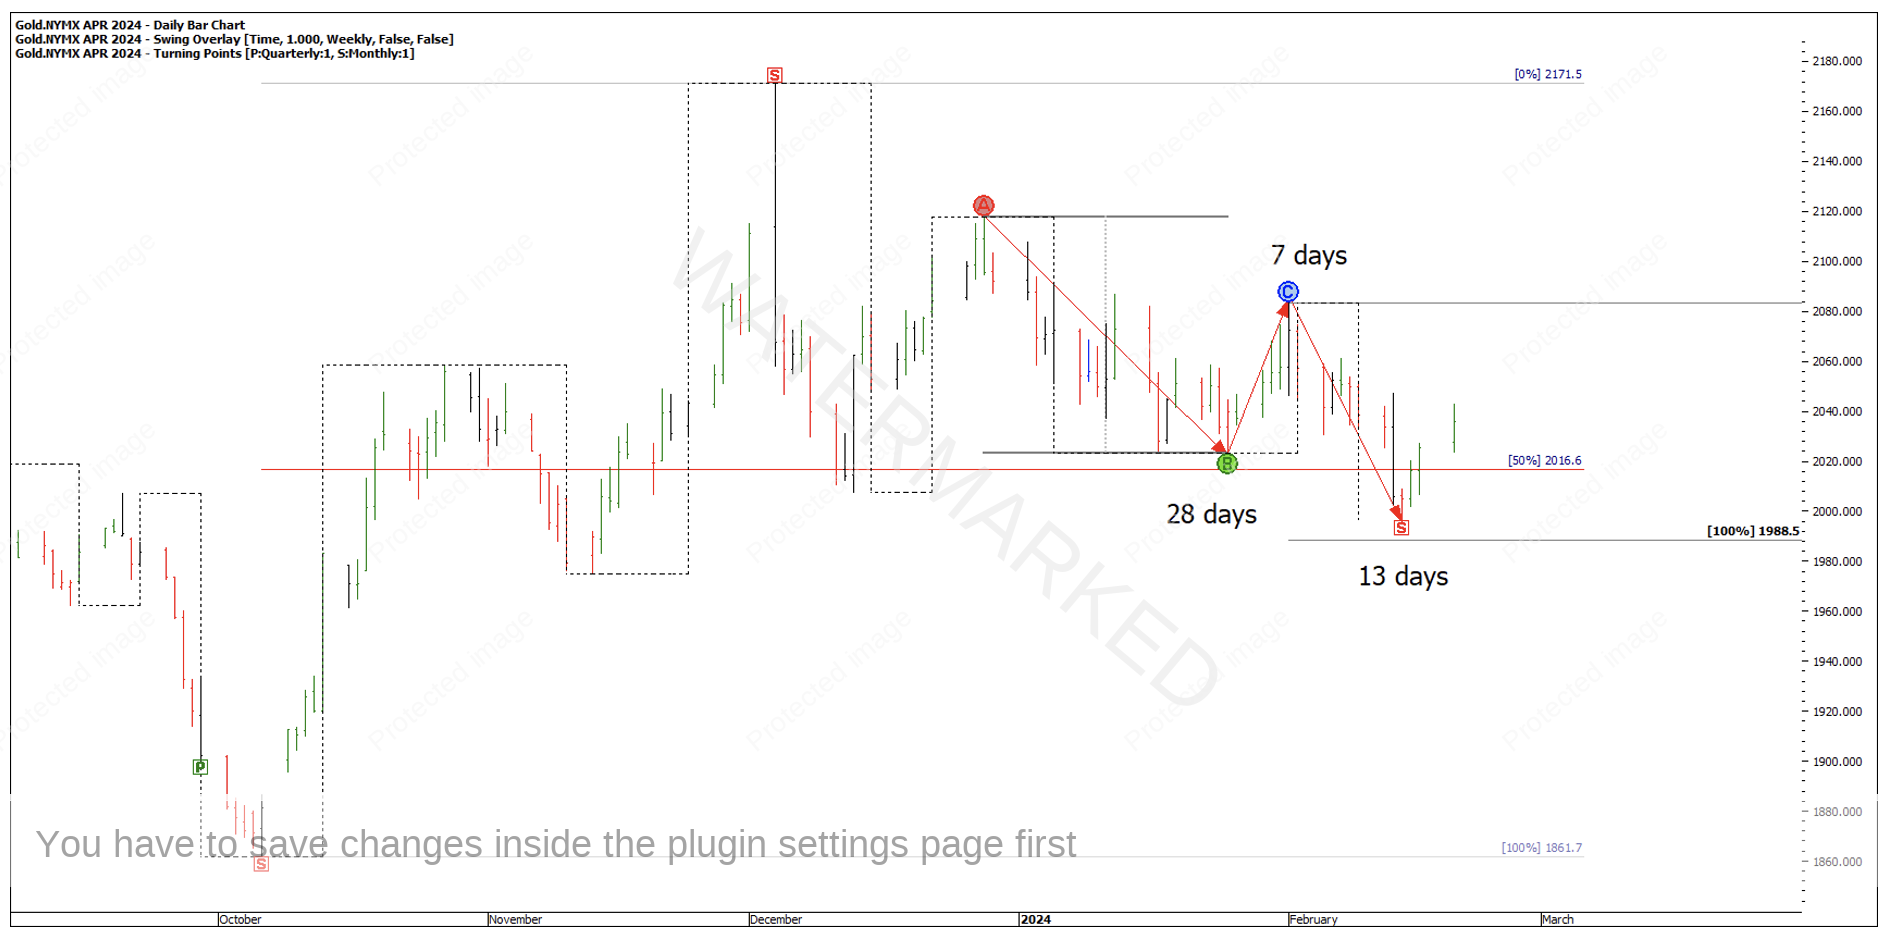
Chart 4 – Gold Time Trend Analysis
This could well be the early stage of a monthly swing low and a potentially good trading opportunity if you follow it through.
Watching for a daily First Range Out Re-test or Weekly Re-test or even waiting for All-Time Highs to be broken again could still get you in early enough to bank a high Reward to Risk Ratio trade to be well on your way to doubling your account this year.
Happy Trading,
Gus Hingeley