Could you Google this?
This month, let’s take a look at the Big G…
Google wasn’t always the world’s second most valuable company. Eventually, the little g, which started in 1995 as a Stanford University PhD research project, grew into the big $367 billion big G that we know today. Every time we search on Google, we contribute around $0.05 to the tech giant’s revenue. Google earns around $8 billion per month in advertising revenue, which is around $0.05 per search.
As the tech giant constantly grows in revenue, its stock has produced a double top at the all-time high of $1,296.97. The initial high was produced on 27 July 2018 at $1,291.44 and the second top occurred on 29 April 2019 at $1,296.97.

While it might have seemed impossible to catch the exact top, if you were looking at the bigger picture, it might have provided some insights.
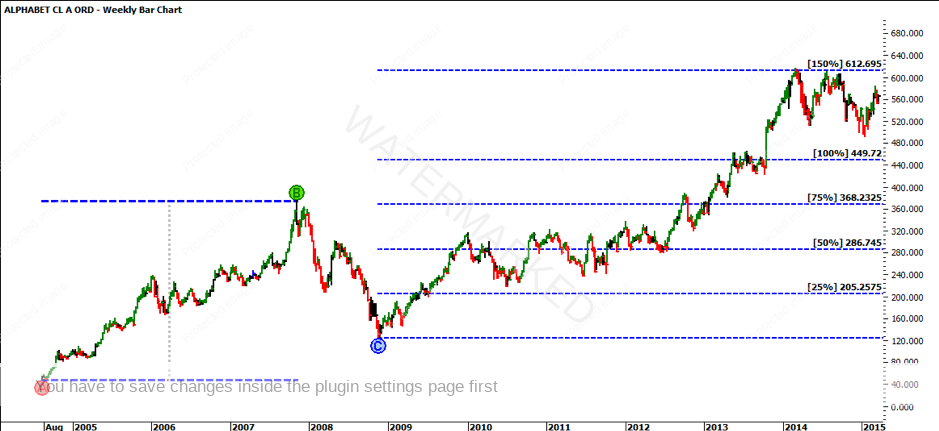
The all-time low on Alphabet, a combined number of Google products such as Google, Gmail, Google Drive; (ProfitSource code: GOOGL) was in August 2004 at $48.03. Placing a Point A on this low and a Point B on the next major proceeding top at $373.98 in 2007, we get a range of $325.95. Projecting this range up from the 2008 low at $123.77 we have a projected 100% target of $449.72. While being held up at the 100% milestone, the market went on to hit 150% prior to having a decent pullback. This was an expanding market.
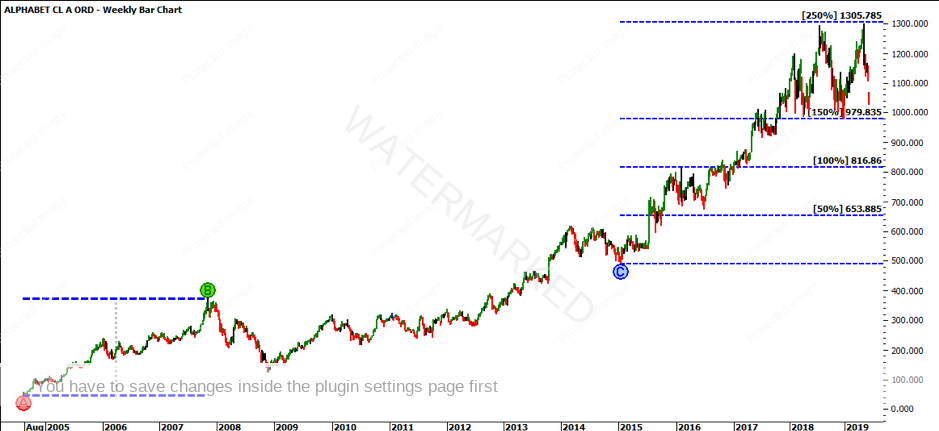
Similarly projecting the FRO up from the next proceeding low in 2015 at $490.91 you can see that the market hit 100% and reacted, as well as hitting 150% and getting held up, prior to double topping at 250%. While this is the bigger picture, this is worth breaking down further to see if there was a price cluster at the ATH.
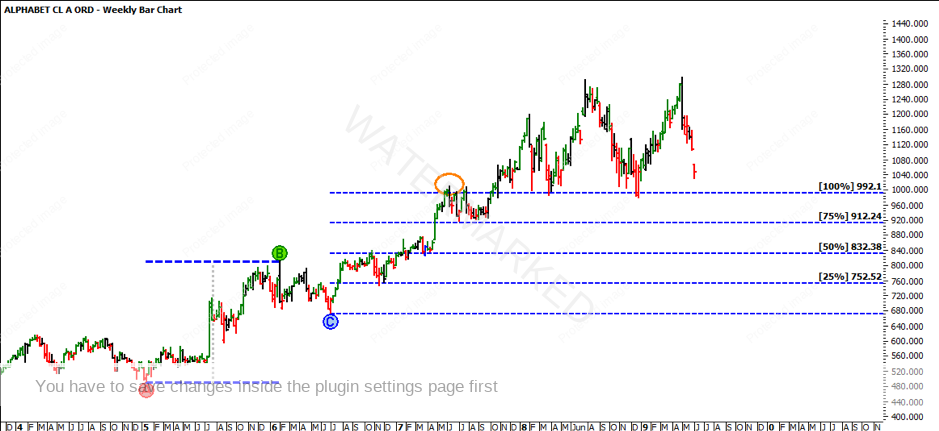
We will predominately focus on the third section that repeated 100%. It will be your task to break down sections one and two to see if you have further confirmation. The third section ran from 2015 to 2019. Looking at the wheels within wheels, the first range out from the 2015 low was $319.25. This is around $6.00 off the FRO from 2004. Projecting this range from the low in 2016 at $672.66, the estimated 100% milestone was $992.10. The market was able to produce a minor double top, although the market topped at $1,008.61. Take note that the market very much respected the 25%, 50%, 75% and 100% levels.
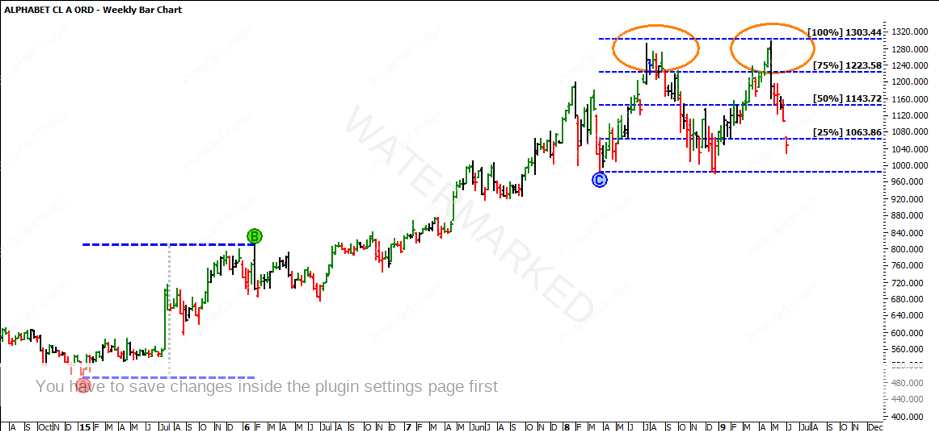
Projecting the FRO from the next proceeding low, forming section three within the larger section, the market struggled to push through and hit the 100% milestone. Interestingly enough, the market triple bottomed on the 25% milestone around the $1,000 mark. These were previous highs and is a good example of old tops becoming new bottoms.

If, however you project the same range from the triple bottoms, you can see the market just about hit the 100% milestone at $1,303.44. The ATH came in at $1,296.97 – which again was around $6.00 difference.
Let’s go back to the ATL at $48.03 in August 2004. By projecting 27 multiples of the ATL you can see the double tops have reacted off this level. Do the math yourself – $1296.97 / $48.03 = 27.00. You cannot get any closer to a 100% multiple than that.

Even the most valuable companies in the world can be broken down to the simplest. I wonder if Google knows its own prime numbers?
It’s Your Perception,
Robert Steer