
Crude Oil
Short Term Trades / Long Term Volatility
2026 has delivered better looking trends, as you can see in Chart 1 there had been primarily sideways prices until the moves associated with Middle East tensions in early 2026.
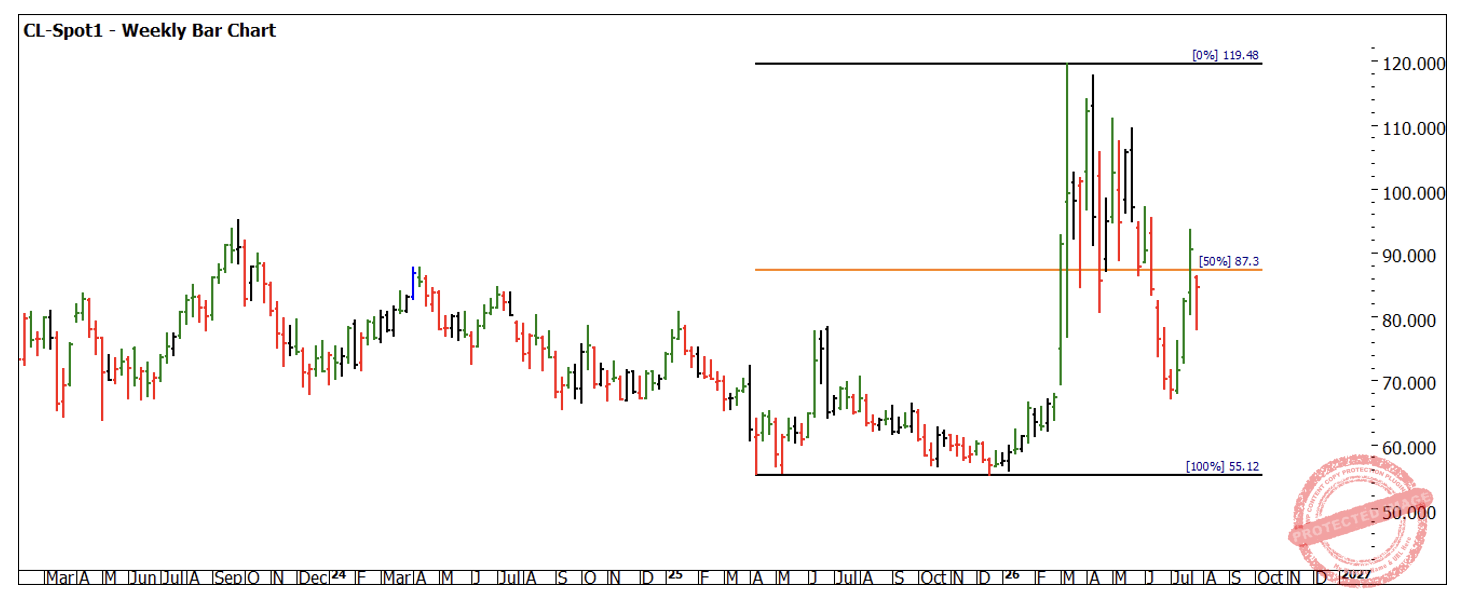
Chart 1 – Weekly Bar Chart CL-Spot1
The weekly chart does allow us to see a bigger overall pattern, what I take from this is when moves commence, they can be short lived (less than a month). This can then be followed by sideways with large intraday volatility. This has meant setting positions and then holding them can be challenging. Moving positions to break even early in a move has ensured capital is preserved.
One of the important charts I have been following, is a Time Trend Analysis chart for Crude over the last 3 years using monthly turns. One important number I follow on Crude is 161, and this appears in a number of ways ie: 168 (natural number from David). We also see a variety of time frames around 80 days, so approximately 50% of that number. 81 to 86 days started to appear as a cycle around the start of 2025.
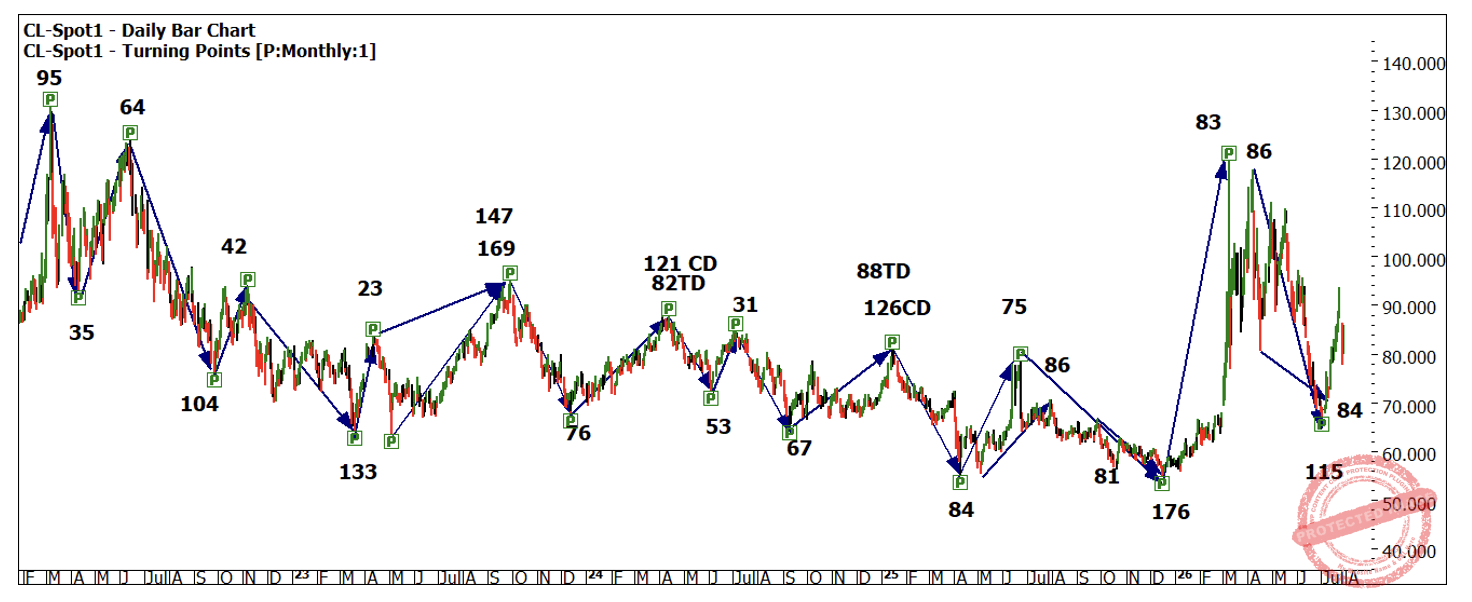
Chart 2 – Daily Bar Chart CL-Spot1
This is a very busy chart, so I would recommend you recreate yours with a level of information on it that allows for you to comprehend the analysis without becoming overloaded.
Zooming in now on the area of July we see a nice first higher swing bottom entry that coincided with a restart of hostilities in the Gulf region. Does the market move based on this announcement or was the announcement due to come in at this time? I will leave you to consider that.
Chart 3 shows a big picture angle that was consistent with some support in July.
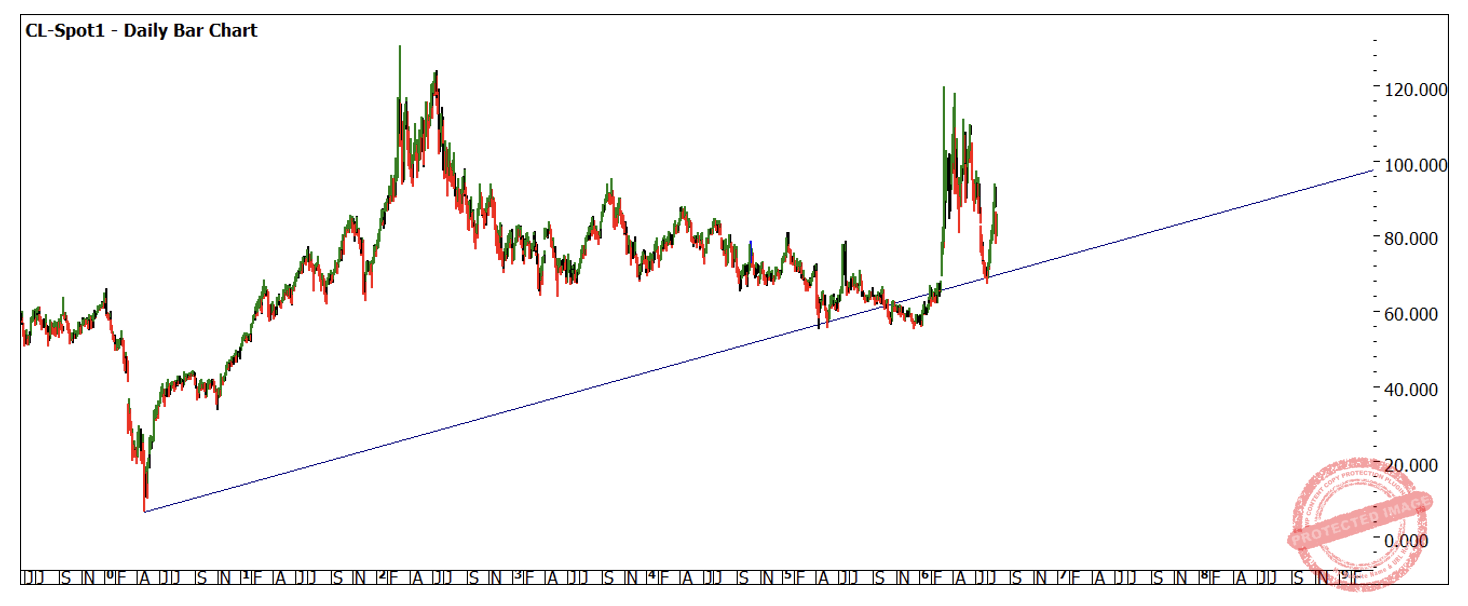
Chart 3 – Daily Bar Chart CL-Spot1
If we overlay the use of the seasonal time window in July and some Time by Degrees and a Retracement Tool, we do have some cluster in price and time.
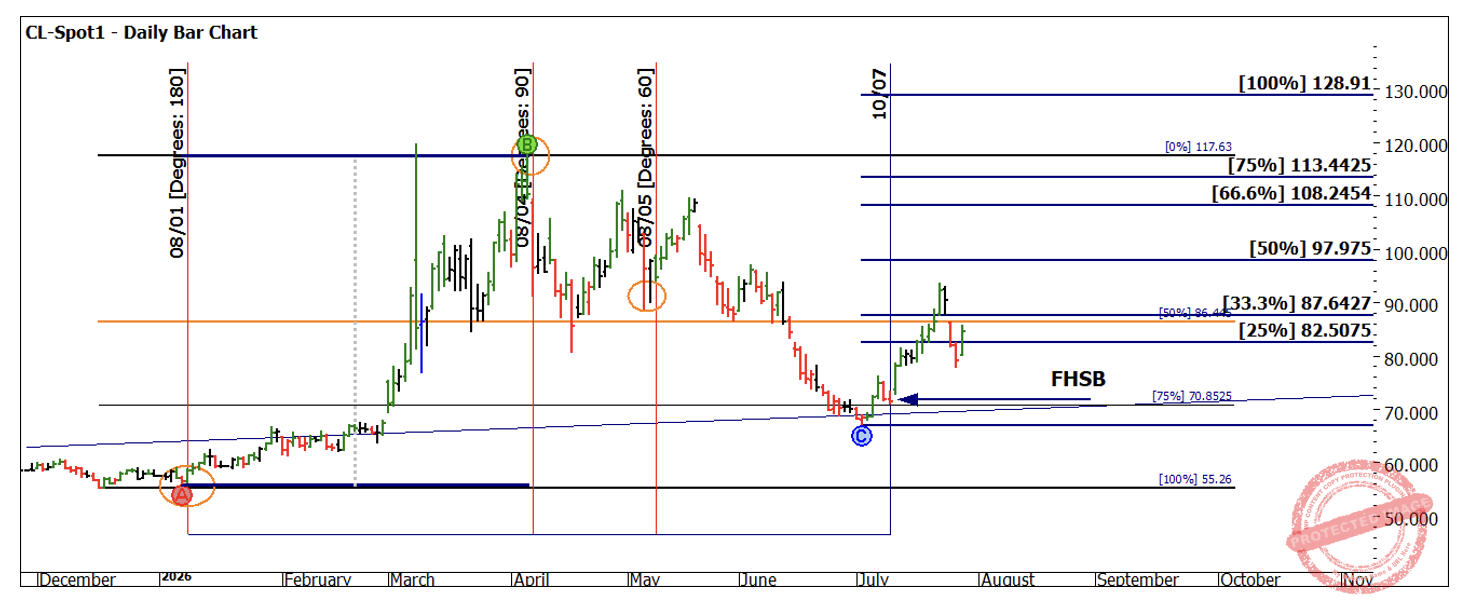
Chart 4 – Daily Bar Chart CL-Spot1
A study worth pursuing is identifying key dates in the market and how regularly it turns in that month. The table below shows the month of July and where we have seen tradeable turns historically. There were several good turns I left off this list as they fell on the 30th of June. There is some good historical evidence that July offers tradeable moves. We could describe this as seasonality for want of a better term.
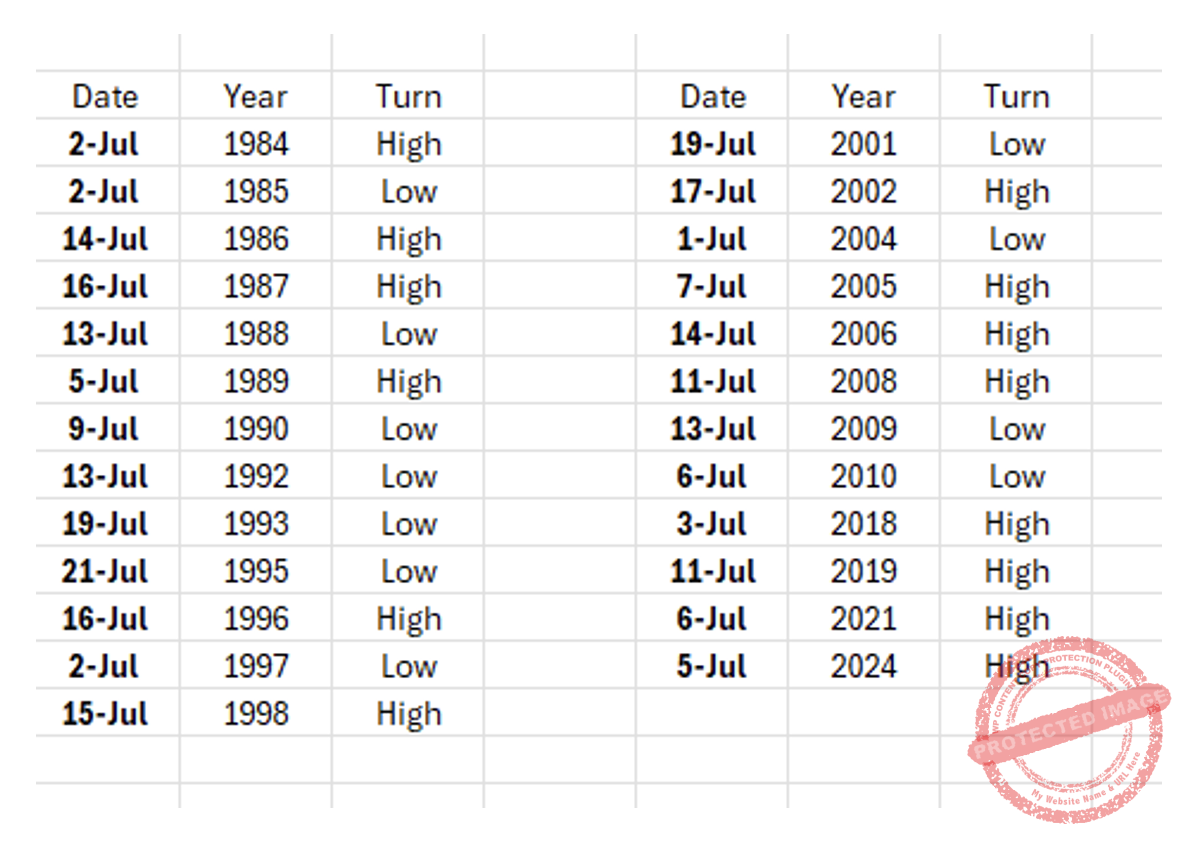
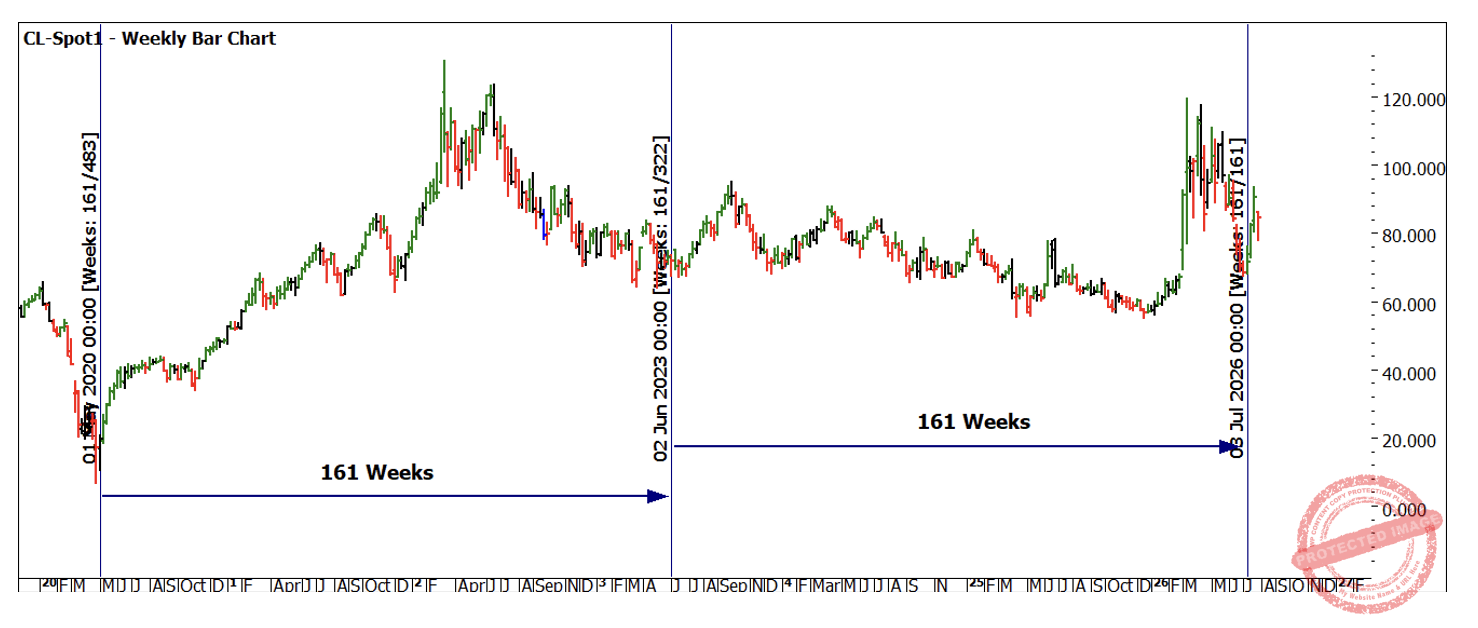
Chart 5 – Weekly Bar Chart CL-Spot1
As I mentioned my favourite entry on Crude is 50% retracements into time pressure, be those seasonal dates or otherwise. In this case the first higher bottom was the safest place to enter and was matched with some intraday harmony on the 1-hour chart.
Charts 6 and 7 show the daily bar chart on ProfitSource and the 1-hour intraday chart. You can see it was 92 hours up, 45 hours down onto an approximate 50% price retracement.
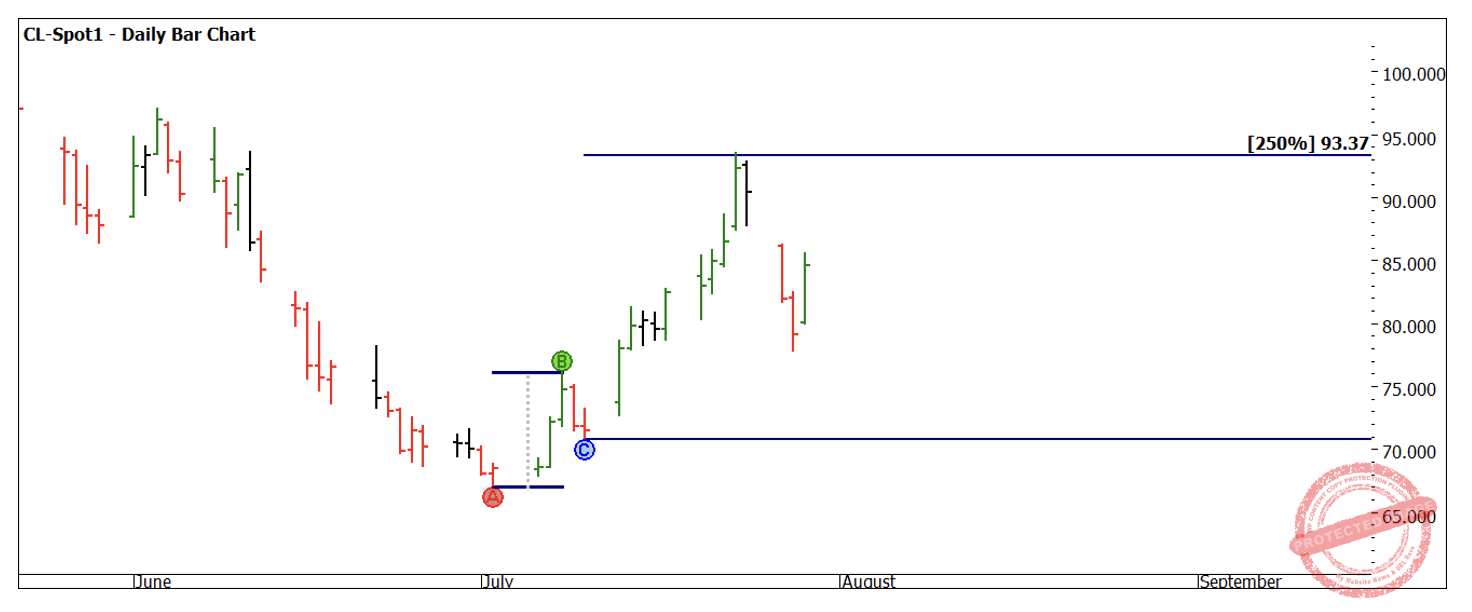
Chart 6 – Weekly Bar Chart CL-Spot1
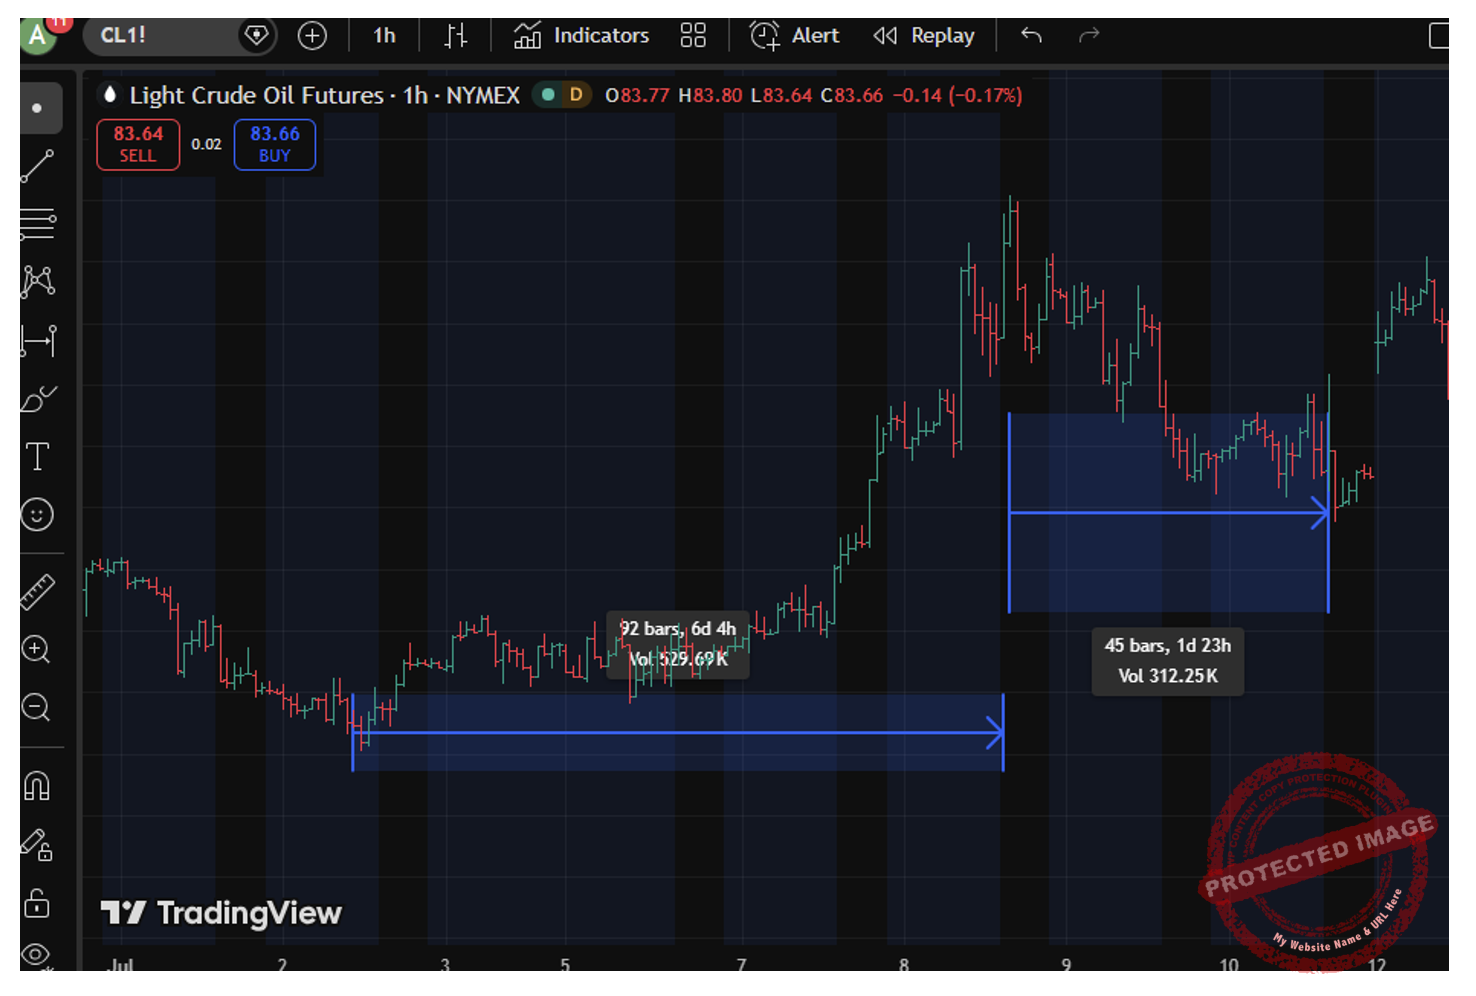
Chart 7 – 1 Hour Bar Chart CL-Spot1
The challenge is to be able to apply multiple techniques and time frames across a chart to allow you to interpret the next move. Take this example and break it down with your own process, I would encourage you to add some squares on this example to see what other support you can build as a case for or against this setup.
Good Trading
Aaron Lynch