Interest Rates and Markets
As interest rates are cut, what are the flow on effects…
As students of history, we must understand the economic outcomes of decisions made over decades or even longer. We are fortunate to have seen the outcome of official interest rates being cut in major markets like the US and Europe over the last decade and the flow on effects to all the financial markets like stocks, commodities and currencies.
Over the last 8 weeks we have seen the Reserve Bank of Australia cut the official cash rate to 1% and they have signalled (with the release of the board minutes) that they are prepared to go lower. Now, this generally speaking, does not bode well for the economy as slashing rates is seen as a sign of weakness to economies. We have seen a slowing housing market (not necessarily a bad thing after the rises we had) and of course, the major handbrake has been inflation. No matter what central banks and governments have done in the last decade, they have failed to drive inflation into the “target bands” they have set. Clearly, we have landed in new markets that are not responding to traditional methods of stimulus. The other over-arching issue is lack of wage growth and this in turn affects all workers as they move higher in the wage brackets.
So how does this engage with the stock, currency and commodity markets? Well for us it creates opportunity. Firstly, we need to get past the whole why are they cutting rates? Why didn’t inflation surge globally after the money printing presses ran hot for multiple years? These are valid questions but don’t allow us to get closer to capitalising on the opportunity. Economics tells us that after the events of the last decade, a sizeable correction is very likely to occur. This will arrive in the future, there is no doubt, and that’s where the cycle work of Gann and David can prepare you.
For now, lower interest rates deter people investing in cash/fixed interest and bonds, due to the lacklustre returns. We all crave a safe investment but are we prepared to forgo any return for that? The concept of negative returns on rates has been floated again, that means charging interest to have your money in the bank, although we are a long way from there at the moment.
When the masses can’t get a return in cash (interest rate products) they are forced to the stock market for a better outcome. The US is proof of what low rates can do to the economy (and the stock market), in Chart 1 we see the Nasdaq index (this index is predominately driven by technology stocks). Using the 1991 to 2000 bullish range and projecting forward we can see the price action trading at 150% of the range, as David teaches us in the milestone chart, 150% is the danger zone. I am carefully watching to see what occurs in the next window of time.
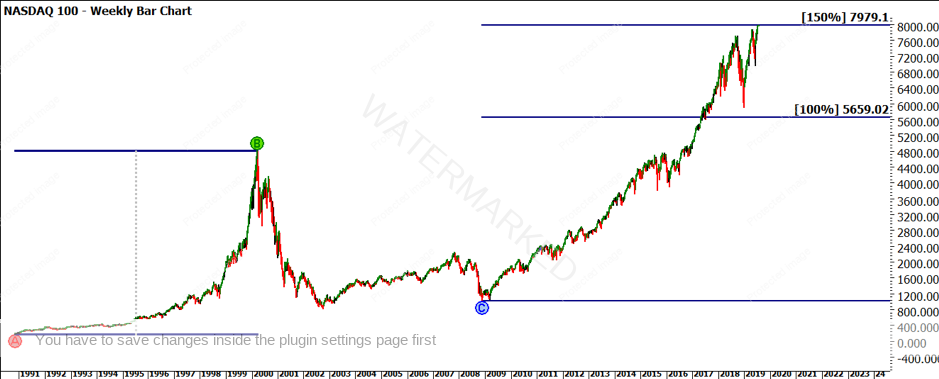
Chart 1 – NDX Weekly Bar Chart
I have discussed previously how the Nasdaq lead the recovery in 2008 and it may also be a good indicator as to when the bull market may end. If we get back to the interest rate discussion, Australia is cutting rates while Europe and the US are neutral on the next move but raising rates seems unlikely in the near term, again good drivers for stock markets.
I had considered adding bond charts to the discussion, though they can be a difficult beast to understand and then go on to trade as a futures contract. The study of bonds and the differences between the bond price and the yields in play are a worthwhile side pursuit to see the effect they have in money markets and asset allocation. The amount of money involved with the bond markets is larger than stock markets so there is a key need to understand how they work.
The effects of cutting rates in Australia has a flow on effect to the Aussie Dollar. In Chart 2 we can see the Australian dollar futures contract and the decline we have seen since the 2018 top (double top) and the subsequent sell off in prices (falling over 10 cents) to the US Dollar. Note the current 200% level.
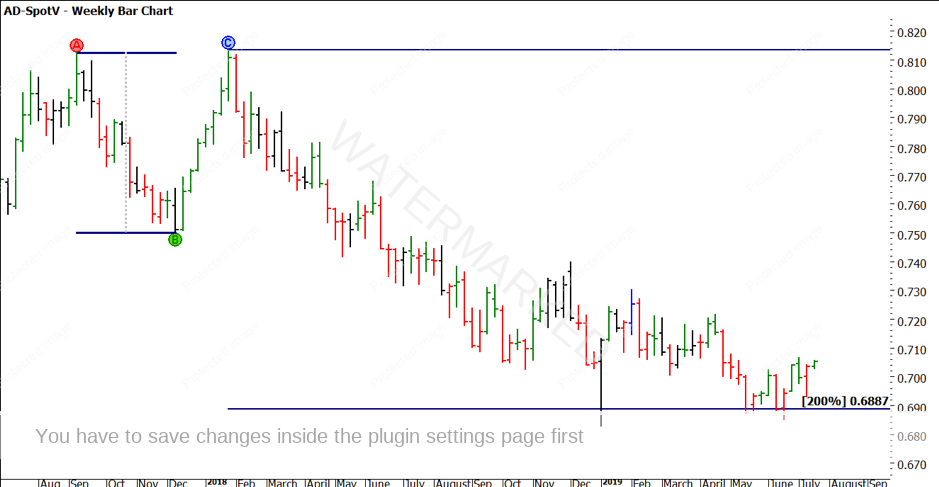
Chart 2 – Weekly Bar Chart AD-Spotv
To link this back to the future of the Aussie stock market, lower rates makes money cheaper to borrow, people with cash looking for a return need to take on risk to establish better than inflation returns and a low Aussie dollar attracts money to flow into Australian markets.
The next two charts in the SPI 200 show our current position in terms of ranges when compared to the two major bullish ranges. From the all-time low to the 2002 high (Chart 3) and the all-time low to the 2007 high (Chart 4). These suggest when compared to other global stock markets we have the room to move higher.
Chart 3 – SPI Monthly Bar Chart

Chart 4 – SPI Monthly Bar Chart
The final part of the puzzle to leave you with for your analysis is what sectors could drive our markets higher? My old favourite of commodities could be the key, quietly churning away in the background. Iron ore has hit new 5-year price highs, stocks like RIO have seen $40 added to their stock prices and BHP $10 in 2019 alone.
If the global economy can awaken from its malaise, the focus could again return to commodities and natural resources of which Australia is fortunate. Therefore, low rates and a low dollar may help spark domestic and overseas funds to look for a home here. The banking and finance sector have had a tough 12 months or so, they may not lead the charge to start with, but may be quick to join any party.
As noted in the charts, there are some important milestones to cross and all bets are off if they are strong enough to reverse markets. Given this type of price and economic outlook assisting you to form a view on markets, you can then look to add some cycle work to the picture and if you can get these to lock in then there is a boost to confidence to execute your trading plan.
Good Trading
Aaron Lynch